
Playground
Full feature reference for /playground. Two tabs, LLM chat against a model credential and a Postman-style connector debugger. Layout, controls, response view, and what the playground deliberately does not do.
Last updated 2026-08-28
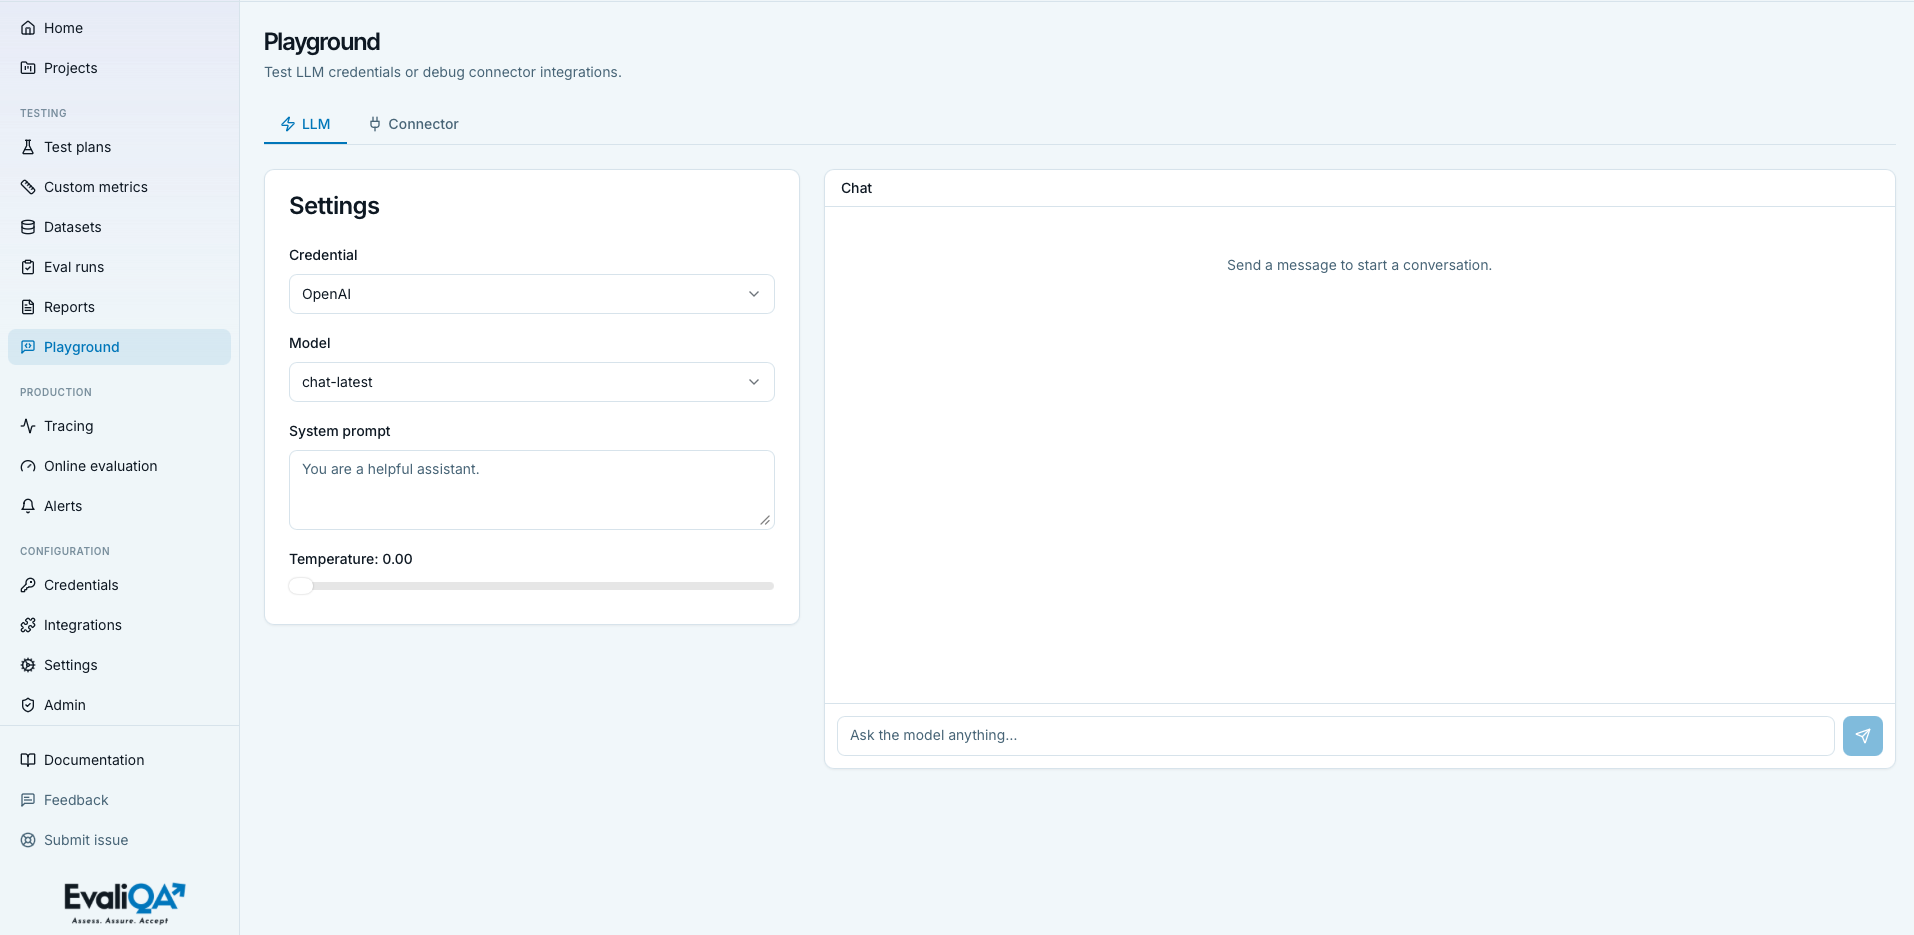
The Playground at /playground is EvaliQA's interactive sandbox for two very different kinds of debugging:
The screencast (0:32) uses both tabs, the LLM chat and the connector debugger.
- LLM tab. Multi-turn chat against any configured model credential. For quick prompt iteration and credential smoke tests.
- Connector tab. Postman-style debugger for HTTP connectors. Fire ad-hoc requests through any active connector, inspect status code, latency, and both extracted and raw response.
Both tabs share the same page shell but do not talk to each other; you can hop between them without losing state.
Nothing you do here writes to any test plan, dataset, run, or report. The playground is deliberately ephemeral: findings must be copied to the right surface by hand. That's a design choice, the playground is for exploration and troubleshooting, not persistence.
When to open the Playground
- After adding a new LLM credential, to confirm it actually works before wiring it into a test plan.
- When a test plan run is failing on the connector step, to reproduce the connector call in isolation and see the raw response.
- Iterating on a system prompt, before committing it to a test plan's target configuration.
- Learning what a new provider's API returns, especially when you're wiring a custom OpenAI-compatible endpoint.
When NOT to use it. For anything you want kept, use test plans, custom metrics, or datasets. The playground doesn't save, promote, or compare.
Layout
Shared shell across both tabs:
- Header.
PageHeaderwith title "Playground" and subtitle "Test LLM credentials or debug connector integrations." - Tab bar below the header with two tabs:
- LLM (
Zapicon). - Connector (
Plugicon).
- LLM (
- Both panels stay mounted at all times, tab switching just toggles visibility. Form state and chat history in each panel survives switching.
- Each tab uses a two-column layout inside: settings card on
the left,
ChatPanelon the right at fixedh-[600px].
Tab state is local (useState); there is no URL parameter for
the active tab, deep-linking to a specific tab isn't supported
today.
LLM tab
For iterating on prompts and models. Multi-turn chat with full control over system prompt and temperature.
Settings (left column)
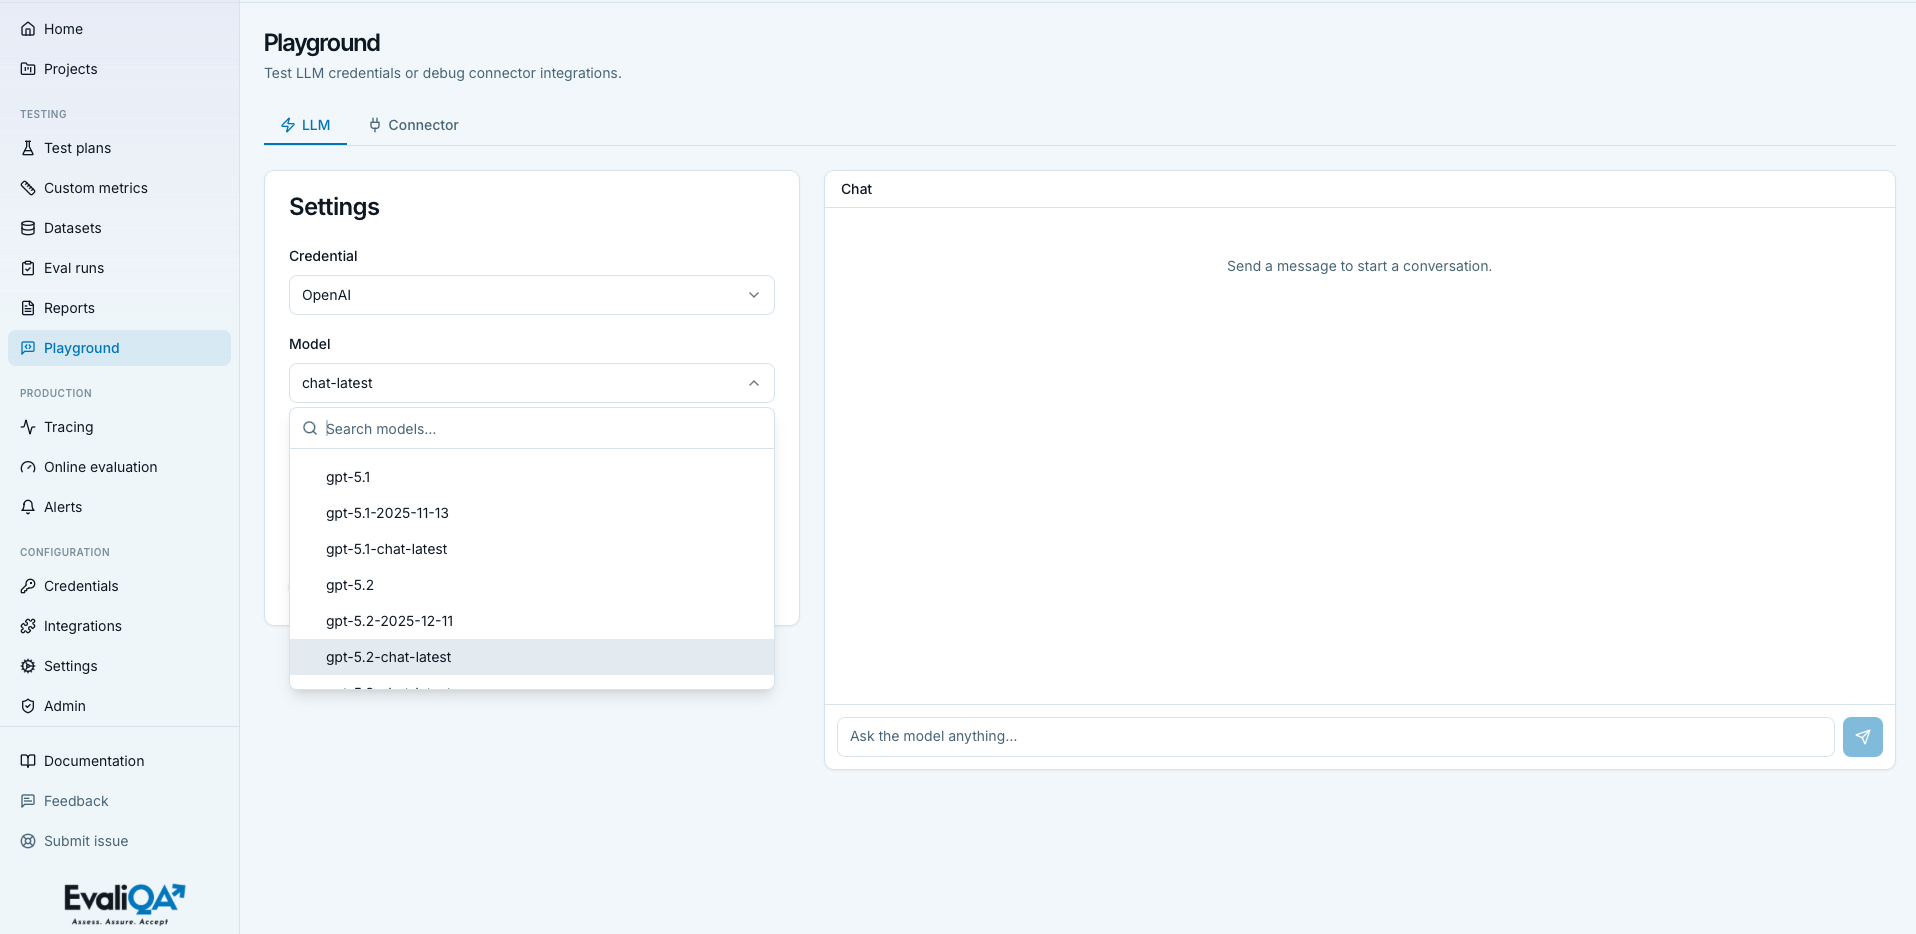
- Credential. Select of LLM credentials, format
" ()". Loaded via
listCredentials. Empty state: if you have no LLM credentials, the panel points you to/credentials. - Model. Select loaded from the picked credential's provider
via
listModels. Disabled until a credential is chosen. Refreshes on credential change. - System prompt. Three-row textarea. Optional. When
non-empty it's included as the leading
systemmessage on every call. - Temperature. Range slider from 0 to 2 in steps of 0.05. Default 0.0. Higher = more creative / less deterministic; 0.0 = maximally deterministic.
Send behavior
- Every send re-sends the full conversation history: the system prompt (if set) plus every prior user and assistant turn.
- Single call per send, no batching, no dataset iteration.
- Cost grows with turn count because the input is the whole history each time. Long chats get expensive; hit Clear to reset.
Response view
Each assistant bubble carries a meta line:
{model} · {latency_ms}ms · ${cost.toFixed(6)}
Cost is omitted when the provider doesn't return one. Token counts and raw responses are NOT shown on the LLM tab, if you need them, use the Connector tab against a connector wrapping the same model.
Not on the LLM tab
- No dataset row picker. You type inputs freely.
- No metric scoring. Attach the metric to a plan and run a one-row dataset if you want a score.
- No saved prompts. The system prompt is free-text; there's no linkage to the prompts library.
- No side-by-side comparison of two models. Open a second browser tab if you want to eyeball two models.
Connector tab
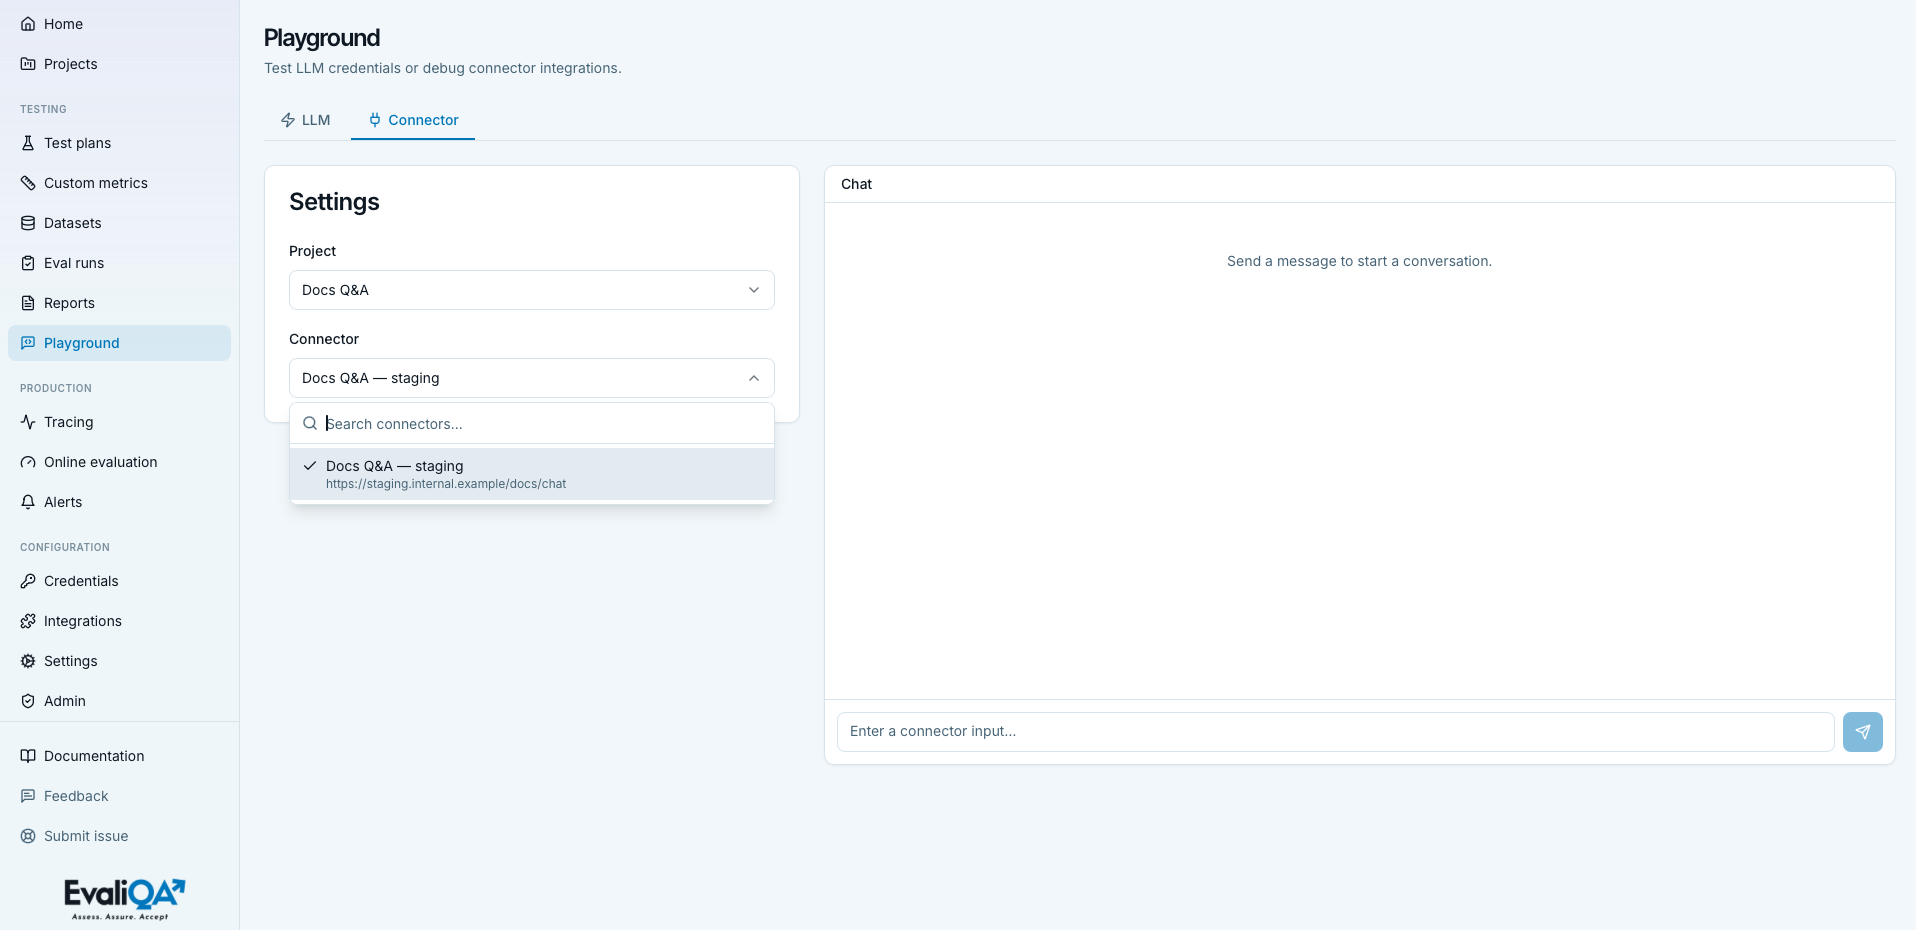
For debugging HTTP connectors. Fire test requests through any active connector in a project and inspect the raw response.
Settings (left column)
- Project. Select showing " ()".
- Connector. Select of the picked project's active
connectors (inactive ones are filtered out). Format
" ()". Empty state: if the workspace has
no projects, links to
/projectsto create one. - Template variables. Auto-detected
{{variable}}placeholders in the connector's template, excludinginput(which comes from the chat text box). Each renders as a labeledInputfield, with the label shown as{{varName}}so you can match it against the connector's template.
Values are stored in a Record<string, string> and trimmed;
empty strings are dropped from the request payload.
Send behavior
- Single
testConnector(connectorId, {input, variables})call per send. - Connector is stateless on the server, the chat history is UI-only and not sent with the request. Each request is independent.
- Switching to a different connector wipes the chat history, since old messages are meaningless in the context of a new endpoint.
Response view
Assistant bubbles show a meta line:
"OK" | "Failed" · {status_code} · {latency_ms}ms
Each bubble carries an Extracted / Raw JSON toggle:
- Extracted view. Renders
result.extracted_outputvia the Markdown renderer (stringified if not already a string). This is what the connector'spath_pickerpulled out, i.e. the value that would flow to metrics in a real eval. - Raw JSON view. Shows the full
result.raw_responsein aJsonTree(default expanded depth 3) with a live search box that filters both keys and values as you type.
Failure bubbles have role error and show result.error ?? "No output". Thrown exceptions surface as ApiError.message in a
banner.
Connector debugging surface
The response object exposes: status_code, latency_ms, ok,
error, raw_response, extracted_output. All of them render
inline in the bubble.
What is NOT rendered in the connector view:
- Request-side details. Headers, body, and URL that were
sent are not shown. If you need to inspect what was sent,
add a
console.logon your target's server or use an external HTTP tap. - Request duration breakdown. You get total
latency_ms, not per-hop timing. - Retries. Playground fires one call, no automatic retry.
Not on the Connector tab
- No metric scoring, same as LLM tab.
- No dataset row picker, feed inputs by hand.
- No comparison of two connectors.
History and save-back
Chat history in both tabs is local component state, wiped on page reload.
- No backend persistence, no session id, no rehydration.
- A Clear button in the
ChatPanelheader wipes the current tab's history. - Connector tab additionally wipes history whenever the picked connector changes.
There are no save-back actions. You can't:
- Save the current LLM chat as a prompt.
- Save a Connector response as a golden example in a dataset.
- Promote the current settings to a test plan.
- Attach a metric here to score a call.
Findings from the playground have to be copied to the right surface manually.
Interpreting responses
- LLM tab, response looks wrong. The prompt, model, temperature, or credential is at issue. Isolate: swap temperature to 0.0 first, then try a different model on the same credential, then a different credential entirely.
- LLM tab, cost balloons after several turns. Your prompt or the history is growing token-heavy. Hit Clear and start fresh; consider whether the system prompt is too verbose.
- Connector tab,
Failed · 401. Auth is misconfigured on the connector. Open the connector settings on the project detail page and fix the auth header. - Connector tab,
OK · 200but Extracted is empty. The connector'spath_pickerisn't finding the reply in the response body. Toggle to Raw JSON and search for a plausible path; update the connector's path picker to match. - Connector tab,
Failed · 5xx. The target is failing. Reproduce outside the playground (curl, Postman) to confirm it's the target, not the connector wiring.
When to use what
Match the debugging question to the right tab:
- "Is this credential valid?" → LLM tab, pick the credential and any model, send "hi".
- "Does this prompt work?" → LLM tab, paste system prompt, send a few realistic inputs, iterate.
- "Is my connector reachable?" → Connector tab, send a minimal request.
- "Is my connector's path picker extracting the right field?" → Connector tab, send a real request, toggle Extracted vs Raw JSON, adjust path picker in the project's connector settings.
- "Do model A and model B respond differently to the same prompt?" → Not here. Create a small plan with 5-10 rows and run it once against each model, then compare on the plan's Eval runs tab.
Tips and nuances
- Both tabs stay mounted. Switching from LLM to Connector and back keeps chat history and settings intact. Reloading the page wipes everything.
- Temperature 0.0 is not "deterministic" for every provider. Some providers still sample slightly; it's just "as deterministic as we can be".
- The LLM tab is faster than clicking Test on the credentials page. Test issues a fixed prompt; the playground lets you send anything.
{{variable}}fields on Connector tab are typed as strings only. If your connector template expects a number or object, wrap the JSON string manually.- The Raw JSON search filters both keys and values. Useful when the response is deeply nested and you don't know what you're looking for.
- Cost on the LLM tab is provider-reported, not EvaliQA- billed. Same source as the eval-runs cost, real dollars.
- The playground does not respect plan-level rate limits.
If you spam Send fast, the provider's own rate limits kick
in. Watch for
429responses. - Voice bots can't be tested here. Use a text-mode connector to the same backend service, or use /voice-eval.
Related
- Where the settings come from. Add your first LLM credential, set up the credentials the LLM tab picks from. Projects page, where connectors are configured (on the project detail page's Connectors tab).
- What the playground can't do (and where to go instead). Test plans page, for reusable scored evaluations. Custom metrics page, for iterating on judge criteria (the playground doesn't score). Eval runs page, for looking at scored history.
- Adjacent debugging. Voice eval page, the voice-bot counterpart when the target is a phone endpoint.