
Eval runs page
Full feature reference for /eval-runs, the workspace-wide list of every eval run. Toolbar, filters, columns (metrics chips, progress, cost), row actions, statuses, and the special rules for deleting queued/running rows.
Last updated 2026-09-08
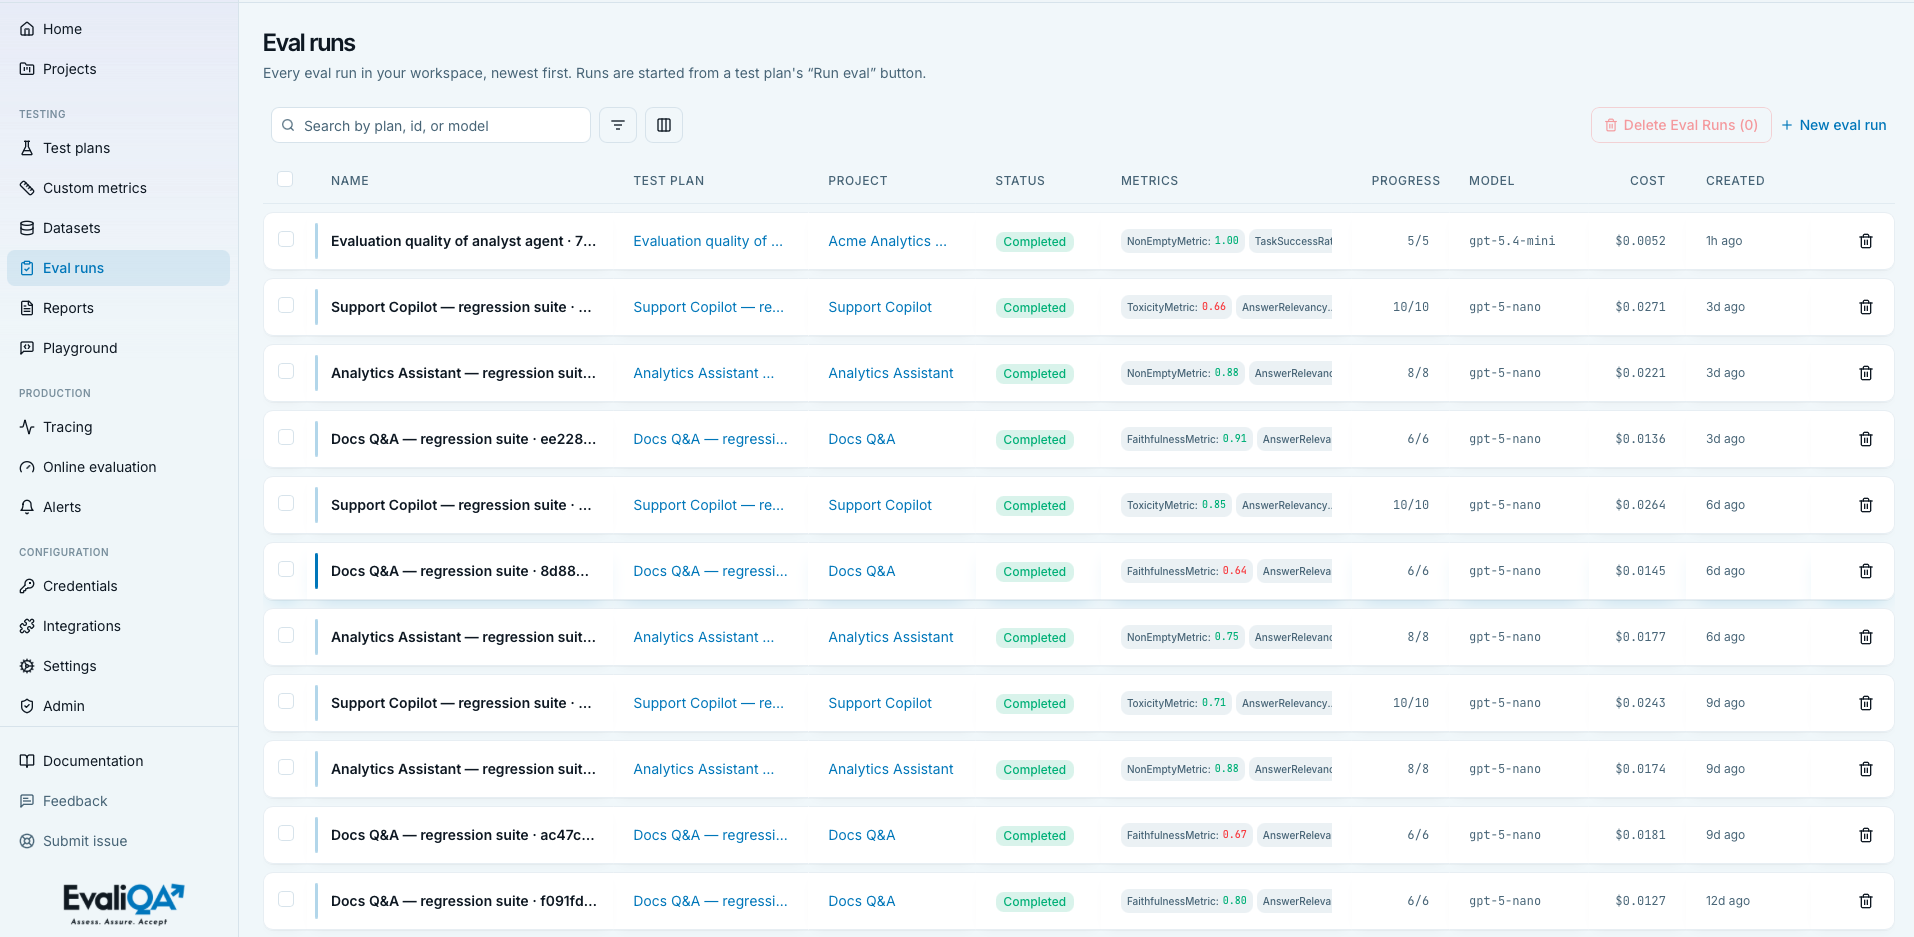
The Eval runs page at /eval-runs is the workspace-wide history of every evaluation ever run. Rows here appear the moment someone kicks off a run from a test plan; clicking a row opens the run detail page.
The screencast (1:03) launches a run from a plan and reads the scored rows.
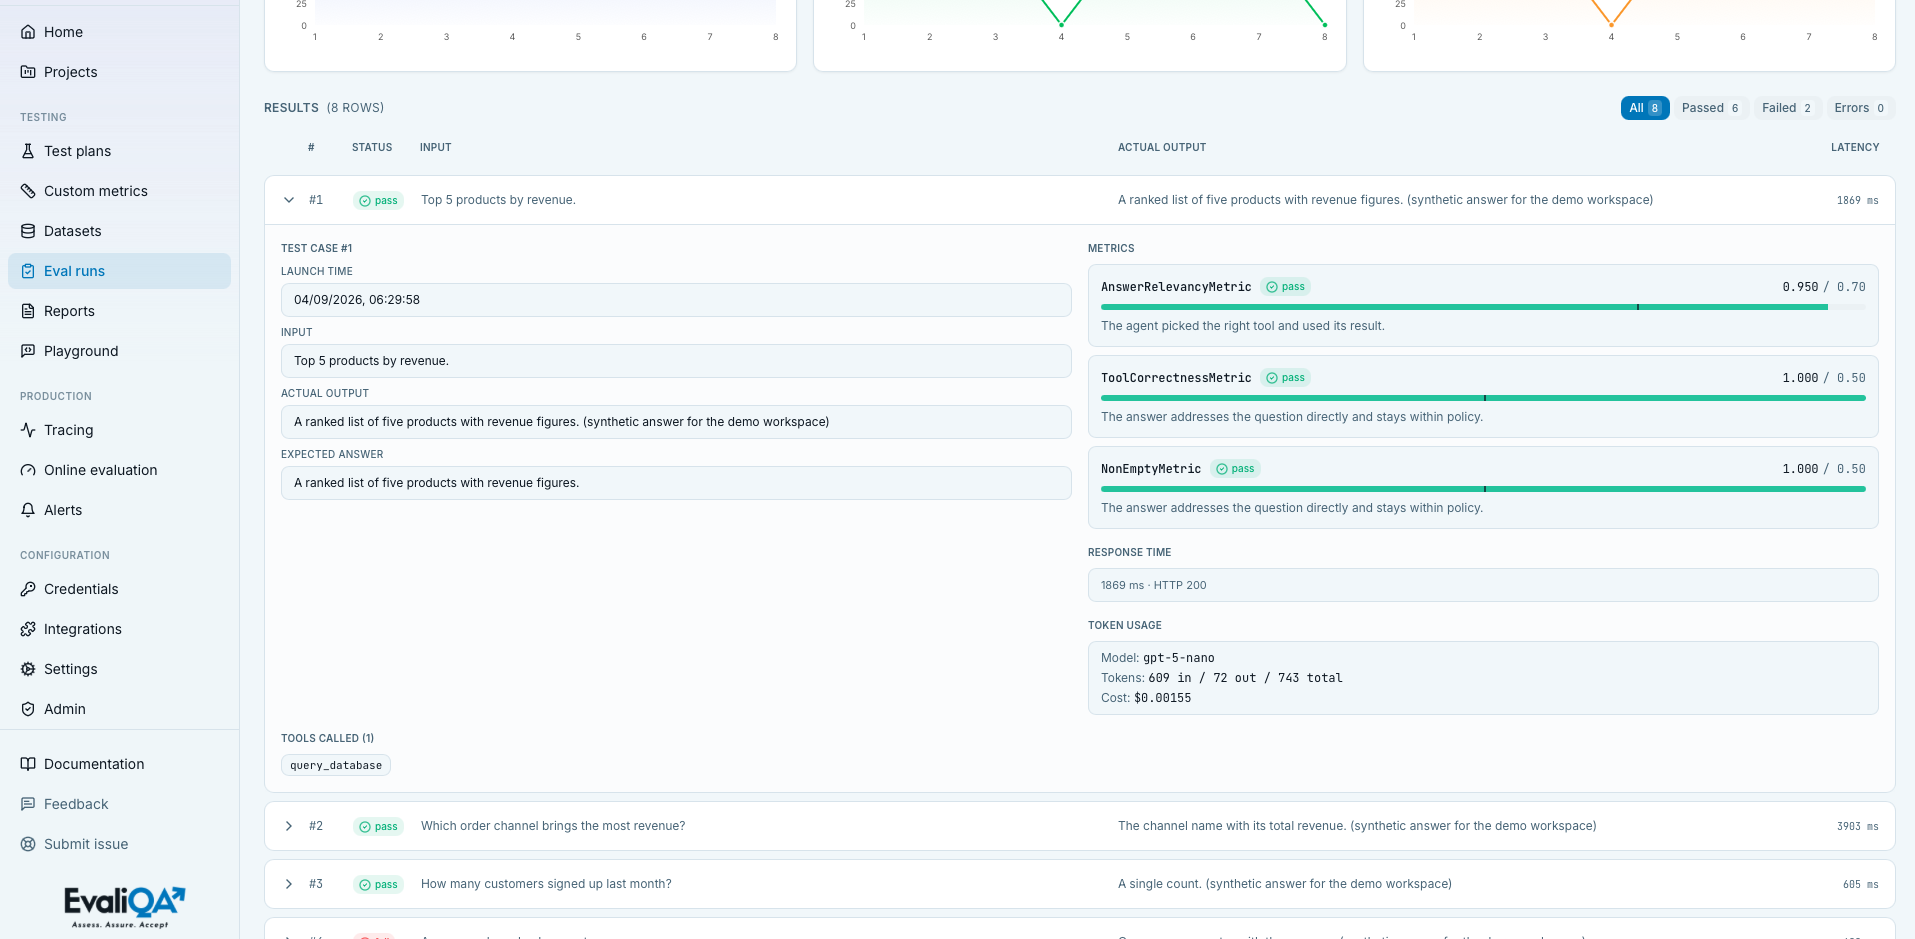
An eval run is one execution of one test plan against one dataset. Runs are immutable snapshots: the plan config at run time, the dataset version at run time, every per-row score, judge reasoning, latency, and cost are all frozen once written. Later edits to the plan or dataset don't affect old runs.
Runs are not started from this page. The empty state and the toolbar's "New eval run" text link both point you back to test plans, that's where the Run eval sheet lives.
For methodology on interpreting a run, see Evaluation results. For per-slice diagnosis (metric, category, persona, cost, latency), see Finding bottlenecks. For run-vs-run analysis, see Comparing runs. For the written-up output, see Preparing a report.
When to open this page
- Audit trail. Every run the workspace has ever done, cross- project, newest first. Useful for compliance ("show me every run against Support-bot in Q1") and for triage ("which runs cost the most last week").
- Cleanup. Bulk-delete stale runs (failed, cancelled, or successful but no longer interesting) to trim the workspace.
- Cross-project comparison at a distance. Filter by Model to see which projects are on which model, or by Cost USD to spot the expensive outliers.
- Landing spot after a Run eval submit. If you started a run from a test plan, you land on the run detail page directly, not here.
What this page is NOT for. Comparing two specific runs side-by-side, that lives on the test plan's Eval runs tab (tick two runs, hit Compare). Reading a specific run in detail, that's the run detail page.
Header
- Icon and title.
ClipboardCheck, "Eval runs". - Subtitle. "Every eval run in your workspace, newest first. Runs are started from a test plan's «Run eval» button."
- No header buttons. All actions live in the toolbar.
Empty states
Three-tier empty state depending on what's missing upstream:
- No test plans. Title "Create a test plan first",
description "Eval runs execute a test plan against a
dataset...". Primary CTA "Create a test plan first" links
to
/test-plans. Hint "You have no test plans yet.". - No datasets (plans exist, no datasets). Title "Generate a
dataset first", again links to
/test-plansfor the generate flow. Hint "You have no datasets yet.". - No runs (plans and datasets exist). Title "No eval runs yet", description "Open a test plan, pick a ready dataset, and click Run eval.". Primary "Go to test plans", secondary "Read the docs".
Filters match nothing. Table renders one row: "No eval runs match this search / filter combination.".
Loading state: "Loading...". Errors: red banner.
Toolbar
Search input
Placeholder "Search by plan, id, or model". Matches the
display name + run id + llm_model case-insensitively. This
covers most reasonable searches ("gpt-4o-mini" narrows to runs
against that target; "refund-bot" narrows by plan name).
Filters popover
420 px wide, ListFilter icon, count pill when rules are
active. Rules combine with AND.
| Column | Kind | Operators |
|---|---|---|
| Name | text | contains, equals (compared against run id) |
| ID | text | contains, equals |
| Test plan | plan enum | equals |
| Project | project enum | equals |
| Status | status enum | equals |
| Model | text | contains, equals |
| Cost USD | number | equals, greater than, less than |
Nuances.
- The Name filter actually compares against
run.id, not the display name shown in the table. Use Test plan or Model filters if you want to slice by plan or target model. - There is no workspace-wide project switcher in the header.
Scoping to one project is done via the Project filter with
equals. If you're mostly working inside one project, use the project detail page's Eval runs tab instead, it comes pre-scoped. - Cost USD filter is on the run's own cost, not aggregated
across time. Use
greater than $10to find the expensive runs worth investigating.
Columns popover
240 px wide, Columns3 icon. Name is required and can't be
turned off. See Optional columns for the
full list.
Bulk-delete button
Red-tinted "Delete Eval Runs (N)". Disabled at N=0. See
Bulk delete for the queued/running special
case.
+ New eval run
Text link styled as brand text; not a button. Links to
/test-plans. Tooltip: "Runs are started from a test plan".
This is deliberate, kicking off a run needs the Run eval sheet
(dataset version picker, connector, column bindings,
concurrency), which lives on the plan detail page.
Column bindings in that sheet are pre-filled for you. A local name
match fills the pickers instantly; once you pick a connector the
server resolver refines them, trying the exact slot name first and
then known aliases (question / prompt / query for input, answer /
reference / ground_truth for expected output). Alias matches carry a
small "auto" badge, so glance over those before starting. The same
resolver backs the CI trigger, which accepts
"column_binding": {"type": "auto"} in its payload.
Row card
Every row is a floating card, clickable to /eval-runs/{id}
(Enter/Space also work). Selected rows tint brand/5. Hover
raises a brand-tinted shadow.
- Left checkbox for bulk selection, stops propagation.
- Brand accent bar on the Name column.
- Name cell is also a
<Link>styledfont-semibold hover:underline. Displayed name is${planName} · ${shortId}(first 8 chars of the run id), orRun ${shortId}when the plan reference is missing (usually because the plan was deleted after the run finished). - Project / Test plan / Dataset cells are brand-colored links to their detail pages, or italic "-" if missing.
- Right-edge action. Single ghost trash icon labeled "Delete run ".
The single row action
Only one thing you can do to a run from the row: delete it.
- Disabled when the run is queued or running, with tooltip "Cancel the run before deleting". Cancel lives on the run detail page's header.
- No kebab menu, no Rerun, no Duplicate, no Compare on the row level. This is deliberate: the row is optimised for scanning many runs.
Where the other actions live:
- Cancel → run detail page header (only when active).
- Rerun → not a first-class action; open the plan and hit Run eval again to fire a fresh run.
- Compare → test plan detail page → Eval runs tab, tick two or more runs.
- Generate report → run detail page header.
- CSV export → run detail page header.
Status badge
Pill next to the row, colored by state:
- Queued (muted grey). Waiting for a worker slot.
- Running (brand blue). Rows are being processed.
- Completed (pass green). Every row got a verdict.
- Failed (destructive red). A systemic error prevented completion. Any rows that got a verdict before the failure are still visible on the run detail.
- Cancelled (muted grey). Someone clicked Cancel.
No pulsing indicator or spinner for running rows, just the brand-blue pill. The page doesn't poll (see Pagination and freshness) so a running row will not visibly progress on this page.
Reading status counts at a glance. Filter by Status to get each bucket's population. A workspace with 30 Failed runs sitting around is a hygiene signal, worth investigating what common thread failed and either fixing it or purging the runs.
Optional columns
Always visible: Name.
Visible by default (in addition to Name / Select):
- Test plan. Brand link to the plan.
- Project. Brand link to the project.
- Status. Colored pill (see above).
- Metrics. See below.
- Progress.
{current}/{total}rows completed, right-aligned monospaced. On finished runs both values match (247/247). - Model. Monospaced target-model string. Tooltip on the full value.
- Cost. USD (see formatting below).
- Created. Relative time.
Hidden by default:
- ID. Full UUID, monospaced, truncated.
- Mode. Uppercase, tracking-wide.
- Dataset. Brand link.
- Started and Finished. Relative time.
- Error. Destructive red text when present, italic "-" otherwise. Full error in tooltip. Turn on when triaging Failed runs.
Metrics chips column
Up to 3 chips of label: score. Score colored:
- Pass green if score
>= threshold. - Destructive red if score is below threshold.
- Neutral otherwise (rare, mostly for metrics without a threshold).
Overflow renders a +N more chip with a tooltip listing the
remaining metric labels. Great for scanning at a glance whether
a run had a metric-specific regression.
Cost formatting
$0.00when cost is zero.- Four decimals under $1 (
$0.0234). - Two decimals under $100 (
$12.45). - Integer with thousands separators above (
$1,240).
This is total cost for the run's own target-model calls. It does NOT include judge cost (which is charged to whichever credential the plan's judge model points at, and shows up on your judge provider's own billing separately from EvaliQA).
Created / Started / Finished
Relative time helpers: "just now", "3m ago", "7h ago", "2d ago", "3mo ago", "1y ago". Full ISO timestamp in the tooltip on hover.
The three columns often disagree: Created is when you hit
Start; Started is when a worker actually picked it up (may
be delayed if the queue is backed up); Finished is when the
last row got its verdict. Finished - Started = actual
compute time; Started - Created = queue wait.
Bulk delete
Row-trash and toolbar-bulk delete both funnel through the same confirmation sheet (entity "eval run" / "eval runs").
The special rule: queued and running rows can't be deleted.
- Each target's meta line reads either the status label alone, or ", will be skipped" for queued/running rows.
- Cascade summary always includes "All per-row eval results and traces for these runs". If any queued/running rows are in the selection, a second line appears: "N run(s) still queued or running, will be skipped".
- Confirmation filters queued/running out client-side before hitting the API. If the entire selection is un-deletable, the sheet shows "N run(s) still queued or running, cancel first." and returns without any API call.
- Otherwise, deletes fire in parallel via
Promise.allSettled. Partial failures concatenate the first error with "N skipped (queued or running).".
To delete an active run, cancel it first from the run detail page header, then the trash icon lights up here.
What is NOT deleted by a run cascade:
- The test plan and dataset (they're upstream, untouched).
- Reports generated from the deleted run stay on
/reportsbut their eval-run link becomes "-".
Pagination and freshness
No pagination. The list fetches the workspace's full run history once and renders it client-side. Filters, search, and column visibility are all local. For very large workspaces (10k+ runs) this can feel heavy; use filters to narrow before scrolling.
No auto-refresh. Data is fetched once on mount, and again after a successful or partial delete. There is no polling, WebSocket, or SSE subscription.
Running rows do NOT auto-update on this page. Progress, status, and metric chips are all snapshot values from the last fetch. To see fresh state, reload the page, or open the run detail: the detail page polls every 2 seconds while the run is active and updates the progress bar and header live.
Interpreting the list at a glance
- Sudden cluster of Failed runs on the same plan = a common cause (credential invalid, connector unreachable, model provider outage). Open the plan and check.
- Long-running Running entries older than a couple of hours = a stuck worker. Cancel via the run detail; if it happens repeatedly, ask an admin to check Admin → Workers.
- Cost column jumps between similar plans = one plan is on a premium judge or has consensus turned on for a custom metric. Open both plans and compare judge model + metric config.
- Metric chips all red on one row, all green on adjacent rows = a specific bad run, worth reading the judge reasoning in row detail. Could be an outlier or the start of a regression.
- Progress stalled at N/M (both non-zero) for a completed run = orphaned progress counter, cosmetic only, the row is actually done. Refresh the page.
Tips and nuances
- Runs on this page are workspace-wide. For a single project or plan, use the project's or plan's own Eval runs tab, both reuse the same table under the hood but come pre-scoped.
- The row's Name cell links to the run twice (the row itself
and the cell's
<Link>). Both go to the same place, either click works. - Metric chips read the run's snapshot metric threshold, not the plan's current threshold. Bumping a threshold on the plan won't retroactively recolor old chips.
- The Model column is the target model, not the judge model. Turn on the Mode column if you're triaging red-team plans, they use a different scoring paradigm.
- Bulk-delete skips protect you from mistakes. You can safely Select All + Delete on a filtered view; the sheet will only actually purge what's actually deletable.
- Deleting a run is permanent. No soft-delete, no recover. Export the run's CSV from the detail page first if the row- level data matters (support tickets, audits).
- The list doesn't distinguish scheduled vs manual runs visually, both look the same. If you need to know why a run fired, check the plan's Runs tab where scheduled runs are tagged.
- New runs arrive at the top. No sort control exposed,
the API's default is
created_at DESC.
Related
- Methodology. Evaluation results, the hub for reading a run. Finding bottlenecks, slicing a run by dimension. Comparing runs, reading two runs against each other. Preparing a report, turning a run into a shareable document.
- Where runs come from. Test plans page, the surface where Run eval is started. Datasets page, the rows a run iterates over.
- Downstream. Reports page, the AI write-ups generated from a run.
- Big picture. Evaluation pipeline, how per-PR / nightly / weekly / monthly runs fit together.