
Explore sessions and traces
The Runtime eval pages, Sessions, Traces, Users, the session timeline, the trace page, the project's Observability tab, and promoting a trace into a dataset.
Last updated 2026-09-07
Once traces flow, Runtime eval is where you read them. It opens on Sessions and has three tabs, one per level of the hierarchy: Sessions, Traces, Users. The project's own Observability tab is the aggregate view over the same data.
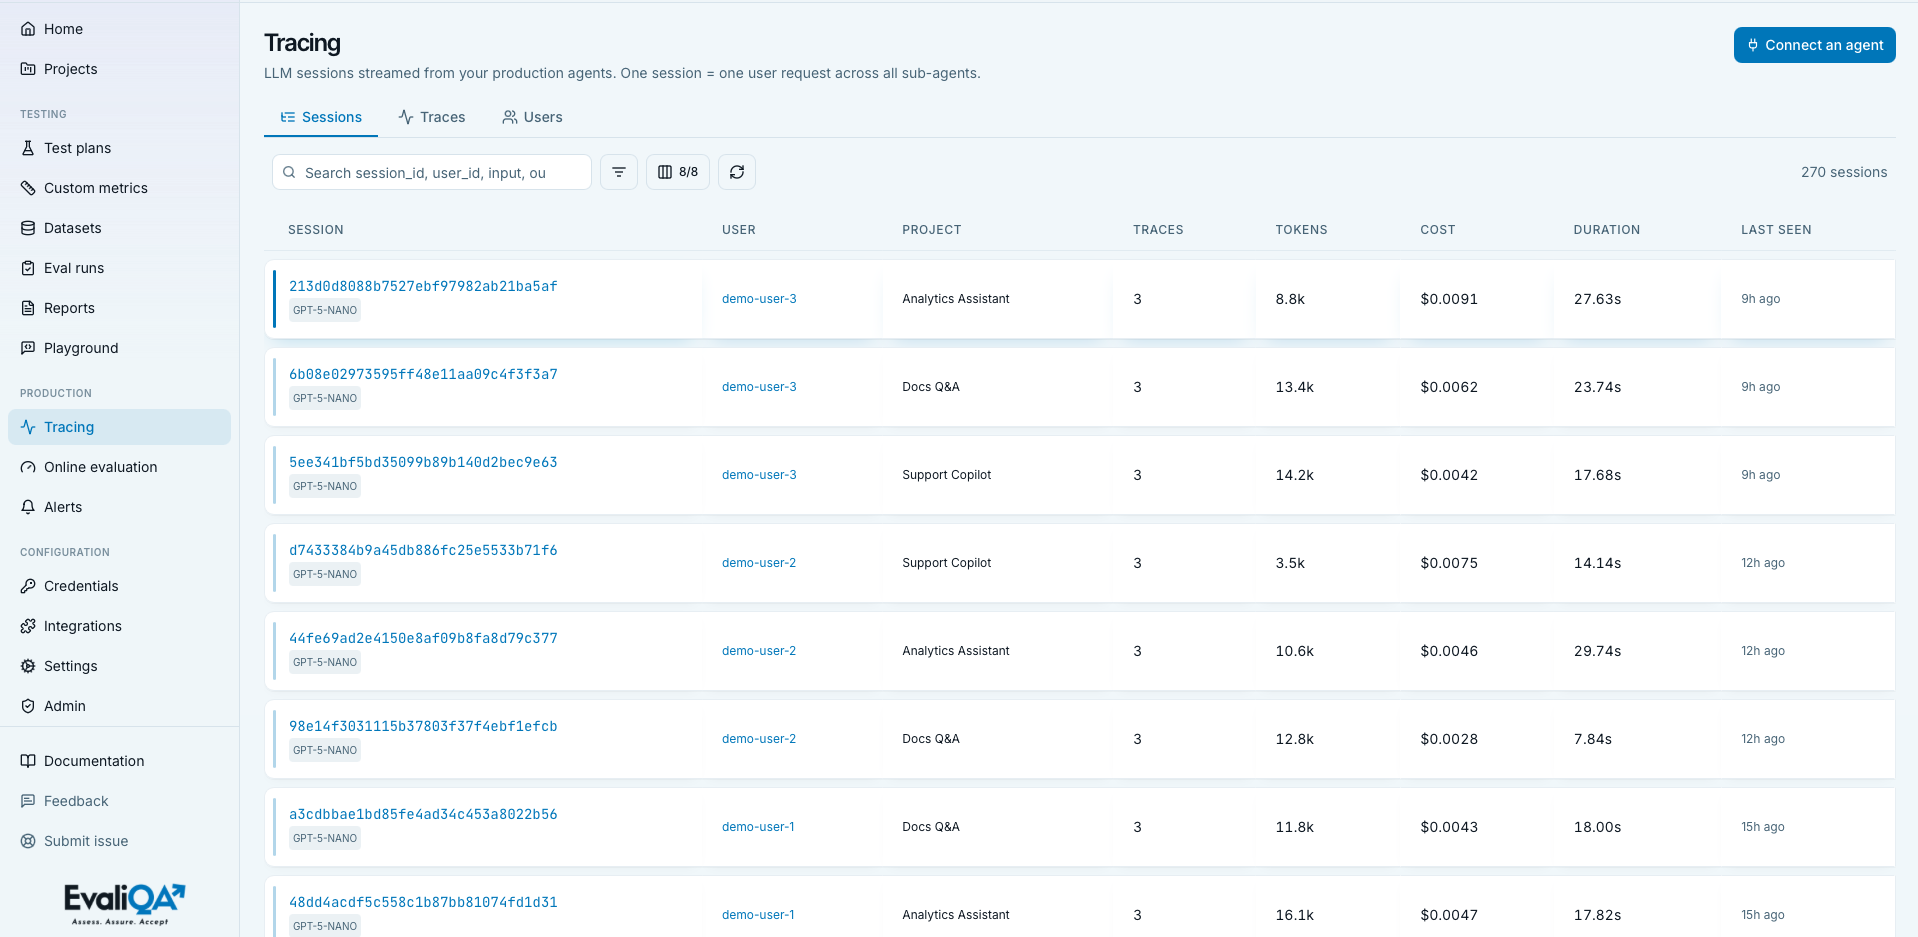
The toolbar
Every tab shares one toolbar:
- Search matches free text across inputs, outputs, span names, and ids. Paste a trace id, a user id, or a phrase from a complaint.
- Project scopes the list. Pick one; the online-evaluation and alerts pages use the same picker.
- Time range presets translate to a
since/untilwindow applied on the server, so a busy project stays fast. - Filters add per-column rules (model equals, cost above, tokens below), and the column picker hides what you don't need.
The Sessions and Traces lists refresh themselves when a trace arrives or an analysis completes; there's no reload button to press.
Sessions
One row per session_id: Session, User, Project, Traces,
Tokens, Cost, Duration, Last seen. Sort by cost to find
the expensive conversations, by traces to find the ones that looped.
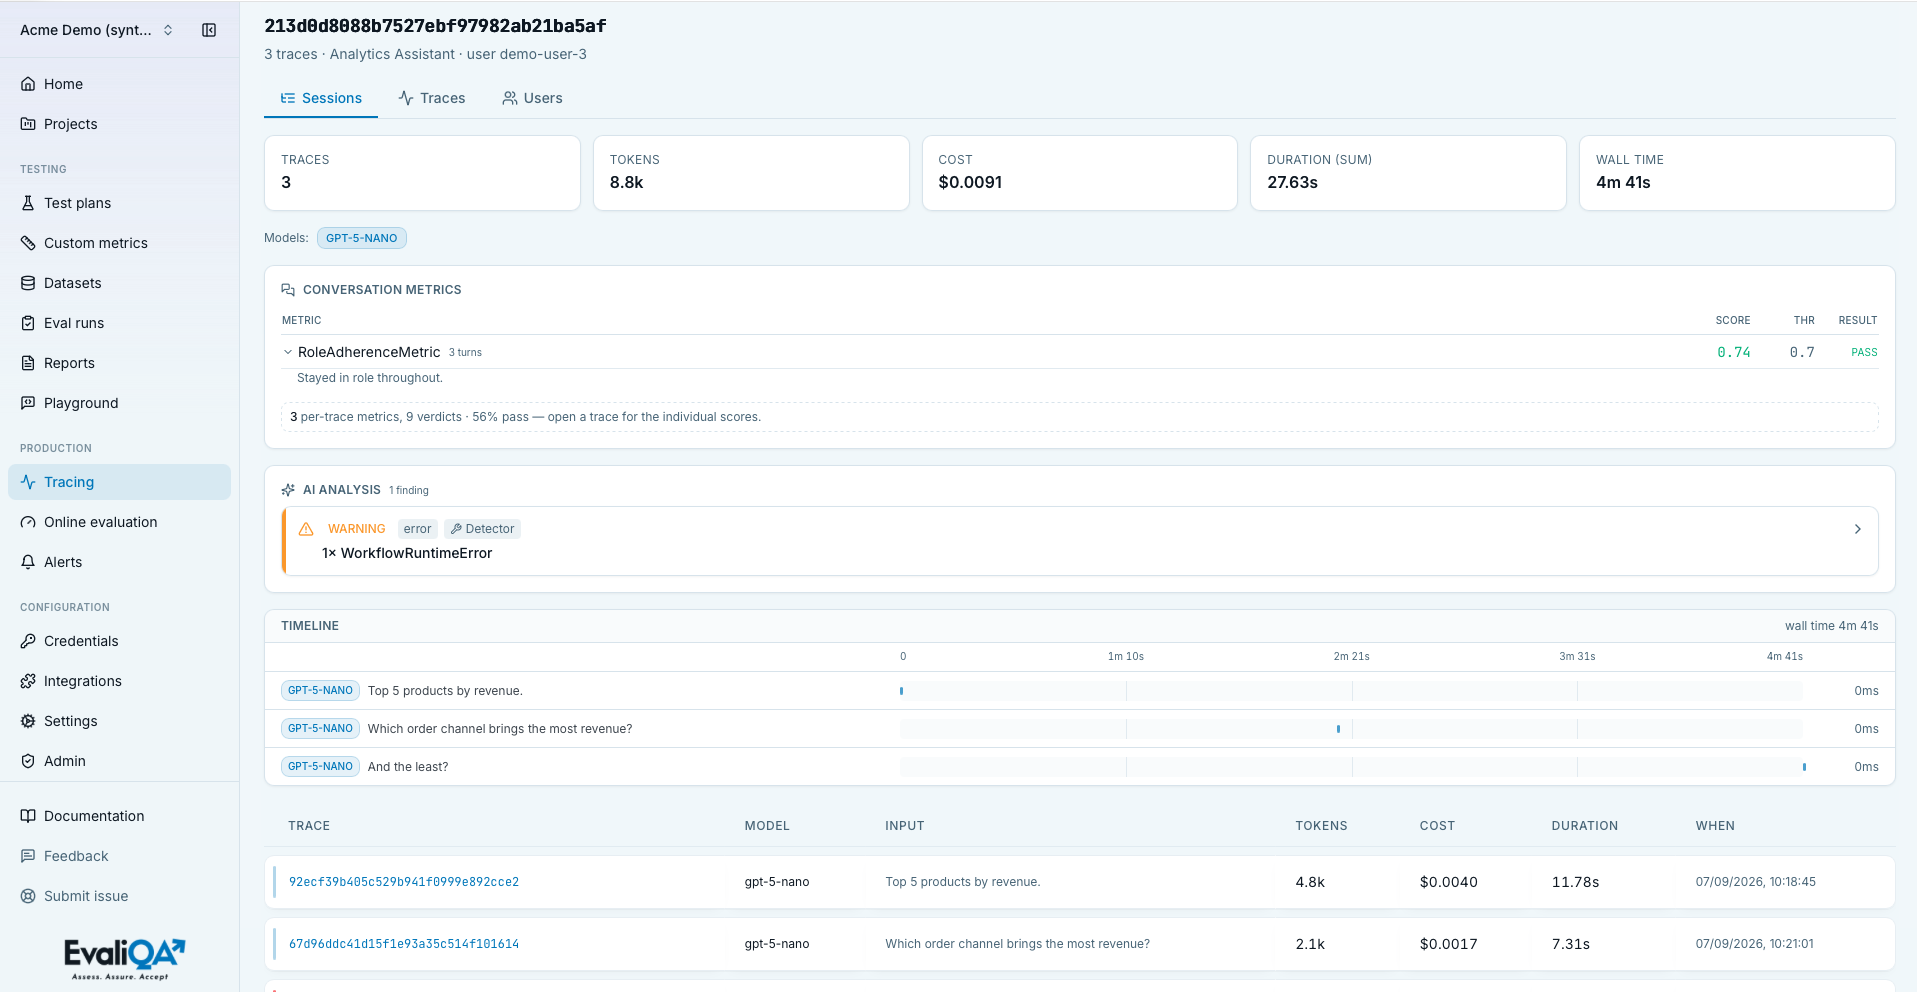
Open a session and you get:
- KPI tiles: tokens, cost, duration, and the models involved.
- Analysis, when online evaluation is on for the project. Up to three cards: Conversation metrics (dialogue-level scores, with the turn count they were judged over), a summary of the per-trace metric scores, and AI analysis, the findings from the detectors and the AI Analyst, each with a severity and the traces it points at. Critical findings open expanded. If one engine didn't run, the reason is printed right there.
- Timeline: a gantt-style view of every trace in the session in wall-clock order, so a planner and its executors read as one story.
- Traces: the traces in the session, with an error badge on any that failed, each linking to its trace page.
Traces
One row per trace: Trace, When, Session, User, Model, Input, Tokens, Cost, Duration, Spans. A red badge marks a trace whose spans include an error; that badge is the fastest way to find what broke in the last hour.
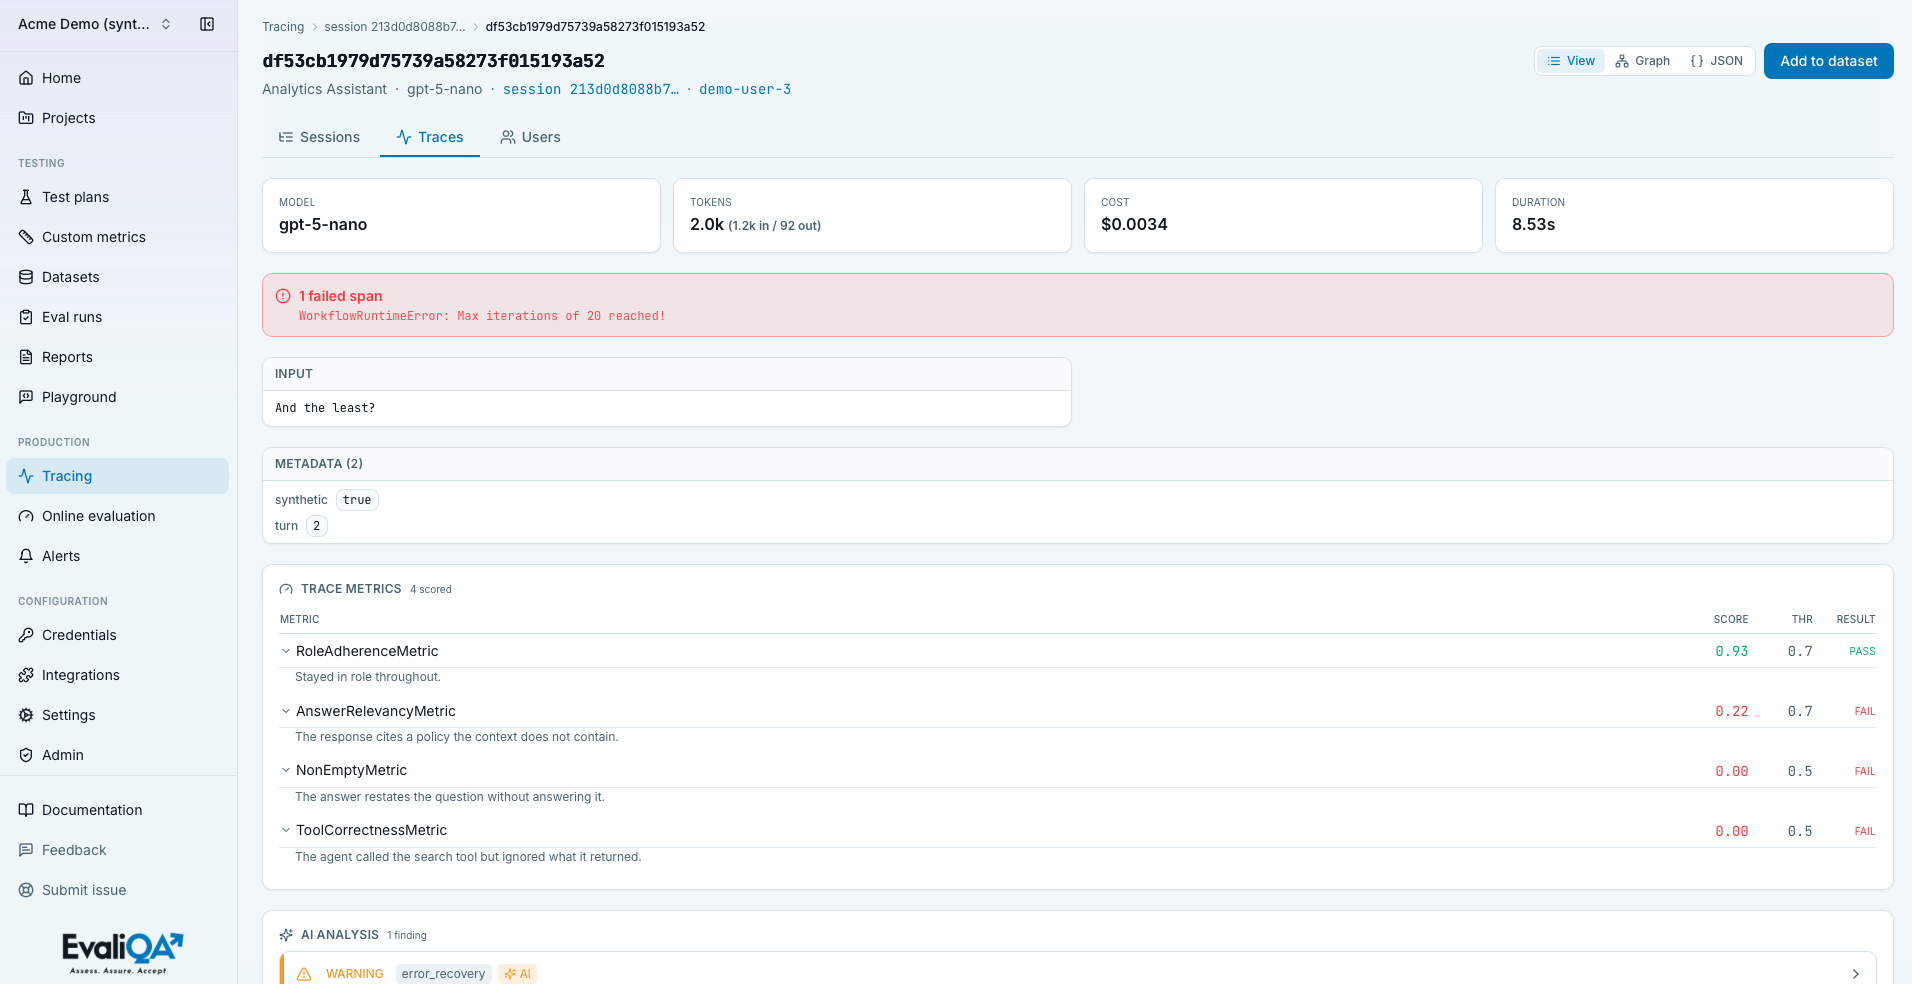
The trace page is the deepest view in EvaliQA:
- Header and KPIs: model, tokens, cost with its
reported/estimatedtag, response time. - Input and output, rendered as Markdown, so a long answer reads the way the user saw it.
- Spans: the tree, each span a card with its type, timing, inputs and outputs, attributes, and an error banner if it failed. Nested spans nest visually.
- Tools called: a collapsible list of the tools the trace invoked.
- Trace metrics: one row per metric that scored this trace, with the score, the threshold, pass or fail, and the judge's reasoning one click away.
- AI analysis: findings that concern this specific trace.
- Add trace to dataset: see below.
Users
One row per user_id: User, Sessions, Traces, Tokens,
Cost, First seen, Last seen. Open a user to list their
sessions. This is the tab for "who is costing us the most" and "show me
everything this person did today".
The project's Observability tab
Open a project and switch to Observability for the aggregate over a time range: Traces, Sessions, Users, Error rate, Cost, and p95 latency as tiles, then Traces over time, Cost over time, Average latency, a By model breakdown, Top errors, Top tools, and Metric quality once online evaluation is scoring. It's the page to leave open on a second monitor; the online-evaluation Overview tab is its quality-focused sibling.

Promote a trace into a dataset
The loop closes here. A real conversation that went wrong is the best test case you'll ever write, so the trace page has Add trace to dataset:
- Pick the test plan the row belongs to. Datasets live under plans.
- Pick the dataset and its version. Versions still generating are hidden; the generator would overwrite the row.
- Map trace fields to dataset columns. Input and output are pre-mapped; tokens, response time, and metadata fields are available; any column can also take a Custom value you type, for example the expected output you now know the agent should have produced.
- Save. The row lands in the dataset and the next eval run covers it.
Do this weekly for the traces online evaluation flagged, and your golden set grows from production instead of from imagination. The Datasets methodology page has the cadence.
Related
- How production monitoring works
- Online evaluation, where the scores and findings on these pages come from.
- Sessions and users, how to make the Sessions and Users tabs non-empty.