
Run your first evaluation
End-to-end, from an empty project to a completed eval run with scored rows and a written report.
Last updated 2026-09-09
You have a workspace, a credential, and a project. This is the moment where you actually score something. The walkthrough takes about ten minutes and ends with a completed run, per-row verdicts, and a report you can share.
In a hurry? Quick eval does all four parts from one screen.
The screencast (1:03) covers parts 3 and 4: launching the run and reading the scored rows it produces.
The flow has four parts:
- Build a test plan: the recipe for how you'll evaluate.
- Attach a dataset: the inputs to score against.
- Hit Run eval and configure the run.
- Read the results and generate a report.
1. Build a test plan with the wizard
Open your project → Test Plans tab (or open /test-plans directly). Click + New test plan in the top-right of the toolbar.
- On a project's Test Plans tab, the wizard opens straight away.
- On the workspace-wide /test-plans page, a small pre-step first asks you to pick which project this plan belongs to, then continues.
If you came from the onboarding checklist (?onboarding=1), the wizard
opens automatically.
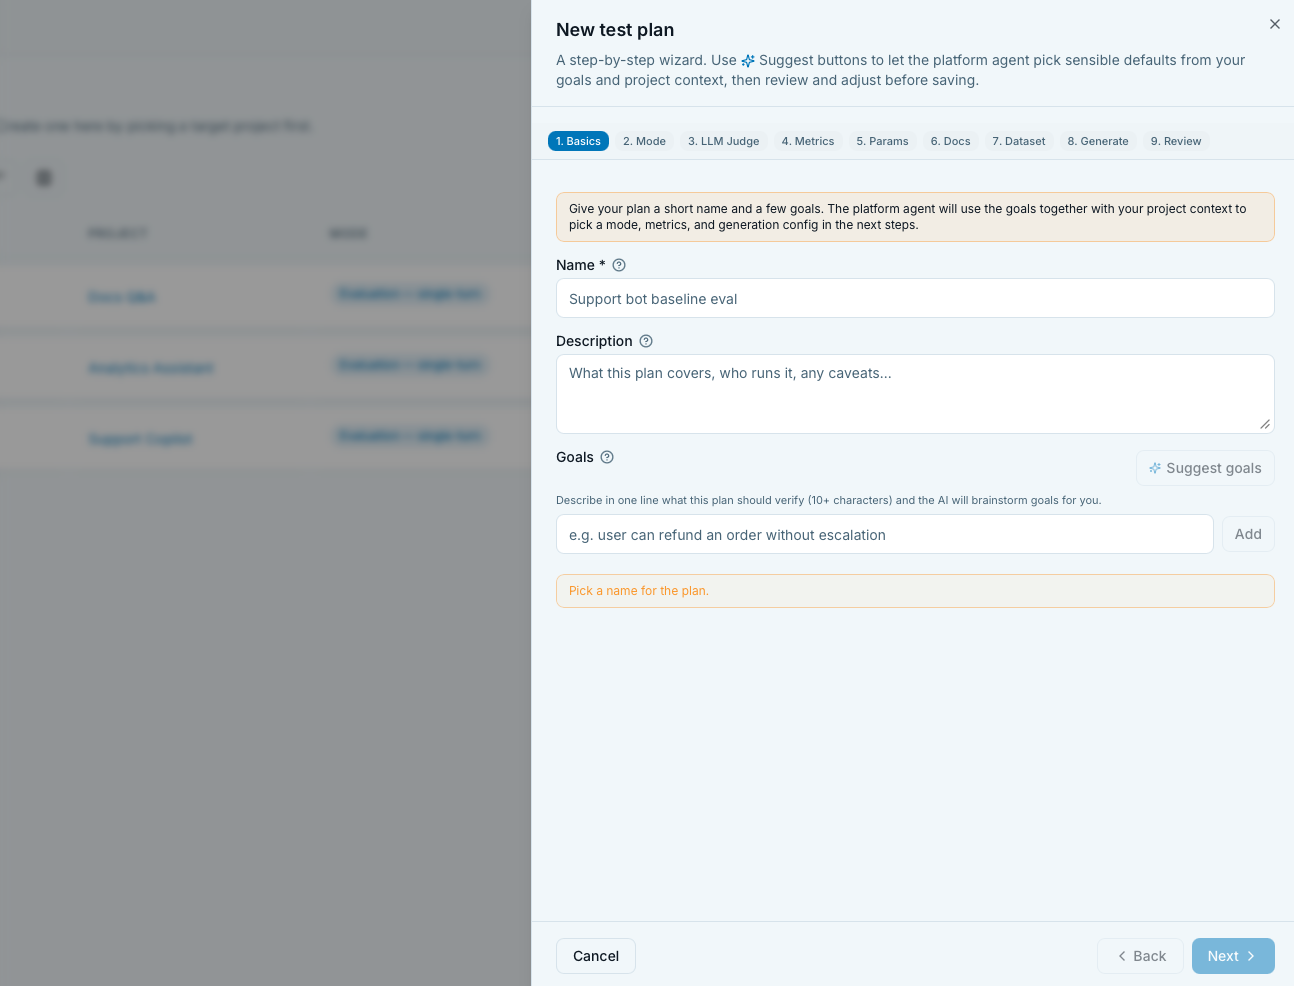
The wizard is a nine-step drawer. You'll see the visible steps as numbered pills across the top and can click back to any completed step. Here's what each step does, most steps take under a minute.
Step 1 · Basics
- Name: what this plan is testing. Short, human-readable.
- Description: one or two sentences. Not required, but if it's ≥10 characters, the ✨ Suggest goals button becomes active and drafts a starter list of goals for you.
- Goals: a chip list of what "good" means for this plan. Click a suggested goal to add it, or type your own and press Enter. These goals feed the later AI suggestions (mode, metrics, generation).
Step 2 · Mode
Pick the channel and mode. Channel is Text or Voice (voice is feature-flagged in your workspace). Mode is one of:
- Evaluation, single-turn (
eval_single_turn), one input row, one scored response. The simplest and the best place to start. - Evaluation, multi-turn (
eval_multi_turn), a whole conversation. Sub-strategy: Simulation (an AI user talks to your agent), Scripted (you write both sides), or Adaptive (needs the Platform Agent to be configured). - Red teaming, single-turn (
redteam_single_turn), probe for vulnerabilities on single prompts. - Red teaming, multi-turn (
redteam_multi_turn), adversarial dialogue.
There's a ✨ Let AI pick mode button; it only ever picks between the two evaluation modes (redteam is never auto-picked).
Step 3 · LLM Judge
Metrics like Answer Relevancy, Answer Precision, and Faithfulness score responses by asking another LLM. This step is shown only when your Platform AI agent runs on your own credential; on platform credits the platform model is the judge, the step is not in the wizard and the plan saves with Platform credits as its judge. On your own key you pick that LLM here:
- Judge credential: one of the credentials you added earlier.
- Judge model: the model list loads from the credential's provider.
This is plan-wide: every LLM-backed metric on this plan uses the same judge. There's no per-metric picker. Reusing your main credential is fine for most cases; using a stronger model as the judge (e.g. GPT-4o judging Haiku's answers) is a common pattern.
Step 4 · Metrics
A grouped catalog of metrics, custom, rag, agent, security,
deterministic, other. Tick the ones you want. Each entry shows a short
description and, if it needs specific columns from your dataset, a
requires_columns badge.
Two AI helpers here (both need the Platform AI agent to be configured):
- Auto-suggest runs once when you land on the step (given a mode and at least one goal). Ticked suggestions carry a ✨ reason line so you know why the agent picked each one.
- Re-suggest metrics button re-runs the suggester after you tweak the goals.
Your saved custom metrics from the workspace appear as clickable
chips under the custom category. Click one to attach a new instance,
CustomEvalMetric and GEval can be attached multiple times if you want
several variants on the same plan.
Red-team modes skip this step: the runtime scores every row automatically by vulnerability and attack technique.
Step 5 · Params
Every metric you picked shows its parameters and threshold here. Fields
are typed (boolean, enum, number, string, string list, text, JSON) and
required ones are marked with *, the Next button stays disabled
until they're filled.
A cheat sheet of {{placeholder}} names from your project's active
connectors appears next to Custom Eval metrics, so a criterion can
reference a field your connector already parses. G-Eval does not
substitute placeholders — it gets a note instead of the chips. Also
skipped for red-team modes.
Step 6 · Docs
Optional. Upload PDFs, Markdown, or text files that ground dataset generation, the agent will pull passages from them when writing test rows. Adding at least one document auto-flips Use documents on in the next step. Documents feature is single-turn only; a warning appears if you toggle it in multi-turn.
Step 7 · Dataset
Two cards:
- Generate new dataset: the agent writes rows for you (configured on the next step).
- Attach existing dataset: clone a ready dataset from another plan in this workspace as a new version under this plan. Filtered to plans with the same mode as this one; you pick the source plan then the dataset version.
Step 8 · Generate
Only shown when you chose Generate new. This is the full dataset generator with sections for:
- Basic: Language, Temperature (0–1, default 0.3), Row count (default 20, cap 1000, single-turn only) or Scenario count / Max turns (multi-turn) or Attacks per vulnerability (redteam, default 3).
- Dataset types: chip picker. If you pick more than one, a distribution slider appears per type and a banner recommends keeping one type per dataset (see feedback on separating dataset types).
- Metamorphic relations, Creativity, Persona types, Vulnerabilities, Attack techniques, Severity, Test categories, Input characteristics, each conditional on the mode.
A ✨ Fill from goals button reuses the same suggester and pre-fills sensible defaults from your Basics step.
Step 9 · Review
Summary of everything you configured, then two save buttons in the footer:
- Save draft: creates the plan in
draftstatus. No dataset generation runs. Use this if you want to review before spending tokens. - Save & generate (or Save & attach), creates the plan, marks
it
ready, uploads any documents, and either kicks off dataset generation or attaches the existing dataset you picked.
Either way, the drawer closes and you're back on the test plans list.
2. The test plan detail page
Click the plan you just created. The detail page has four tabs:
- Overview: a summary of the plan and its history.
- Datasets: the datasets attached to this plan, versioned.
- Eval runs: every run of this plan.
- Documents: files that ground dataset generation.
The header shows the plan name, its status badge (draft / ready /
archived) and mode badge (red for redteam, blue for eval). Header
actions:
- Mark as ready / Revert to draft: flips workflow status.
- Archive / Unarchive: hides the plan from default views.
- Run eval: primary CTA. Disabled until there's a ready dataset and the mode is runnable.
- Edit: reopens the wizard prefilled.
- Delete: asks for confirmation, then routes back to /test-plans.
Attach a dataset (if you saved a draft)
Open the Datasets tab. There are two buttons:
- Attach existing: clone a ready dataset from another plan (same mode, same workspace) as a new version here. The rows are copied verbatim, no worker runs.
- Generate: opens the generate-dataset drawer with the same fields you saw in wizard step 8. Disabled until you have an LLM credential and (for non-redteam plans) at least one metric bound.
There is no CSV / JSONL upload from this page. If you have raw CSV rows, create the dataset via the workspace-wide Datasets page and then use Attach existing here.
Once the dataset row shows a green ready badge (a few seconds for
small counts, up to a couple of minutes for 500+ rows), the Run eval
button in the header lights up.
3. Run the evaluation
Click Run eval. A drawer opens, the fields depend on your plan's mode, but the common layout is:
- Dataset version: only shown when the plan has more than one ready dataset. Otherwise the single version is used automatically.
- Connector: the HTTP integration that calls your agent. Only active connectors from this project appear. If you haven't set one up, add one on the project's Connectors tab first.
- Column bindings: map dataset columns to what your connector
expects (input, expected output, and any others). The form changes
with the plan's mode/strategy. They are pre-filled: a local name
match runs instantly, then the server resolver refines it once a
connector is picked, using aliases such as question / prompt /
query for input and answer / reference / ground_truth for expected
output. Alias matches show an
autobadge; check them before you start. In CI the trigger payload can simply send"column_binding": {"type": "auto"}. - Custom connector variables: one dropdown per
{{variable}}detected in the connector template, mapped to a dataset column. - Custom-metric extra fields: a chip picker, shown only when the
plan uses
CustomEvalMetricorGEval. - Attacker LLM: redteam-single-turn only: pick which model plays the attacker.
- Concurrency: how many rows the runner processes at once. 1–20 for eval, 1–5 for redteam. Higher = faster and more expensive on the provider side.
There is no confirmation step: clicking Start eval run fires
the run immediately, closes the drawer, and takes you to
/eval-runs/{id}. There's also no "run against the first N rows"
subset; if you want a cheap dry run, generate a small dataset (Row
count = 10) and use that as the version for this run.
4. Read the results
You land on the run's detail page. The header shows the run's short id, the plan mode, the model, and a status badge, one of:
- Queued (grey), waiting for a worker.
- Running (brand blue), rows are being processed.
- Completed (green), every row got a verdict.
- Failed (red), the run hit a fatal error. Any completed rows are still visible.
- Cancelled (grey), you or a teammate stopped it.
While the run is queued or running, the page polls every 2
seconds and updates the progress bar and the header. A "Polling every
2s…" line under the progress bar tells you it's live.
While it runs
- The progress bar shows completed / total rows.
- The Cancel button appears in the header (red). Clicking it stops the run immediately, no confirmation dialog, so use with intent.
- KPI tiles and per-metric charts appear only after the run finishes.
When it's done
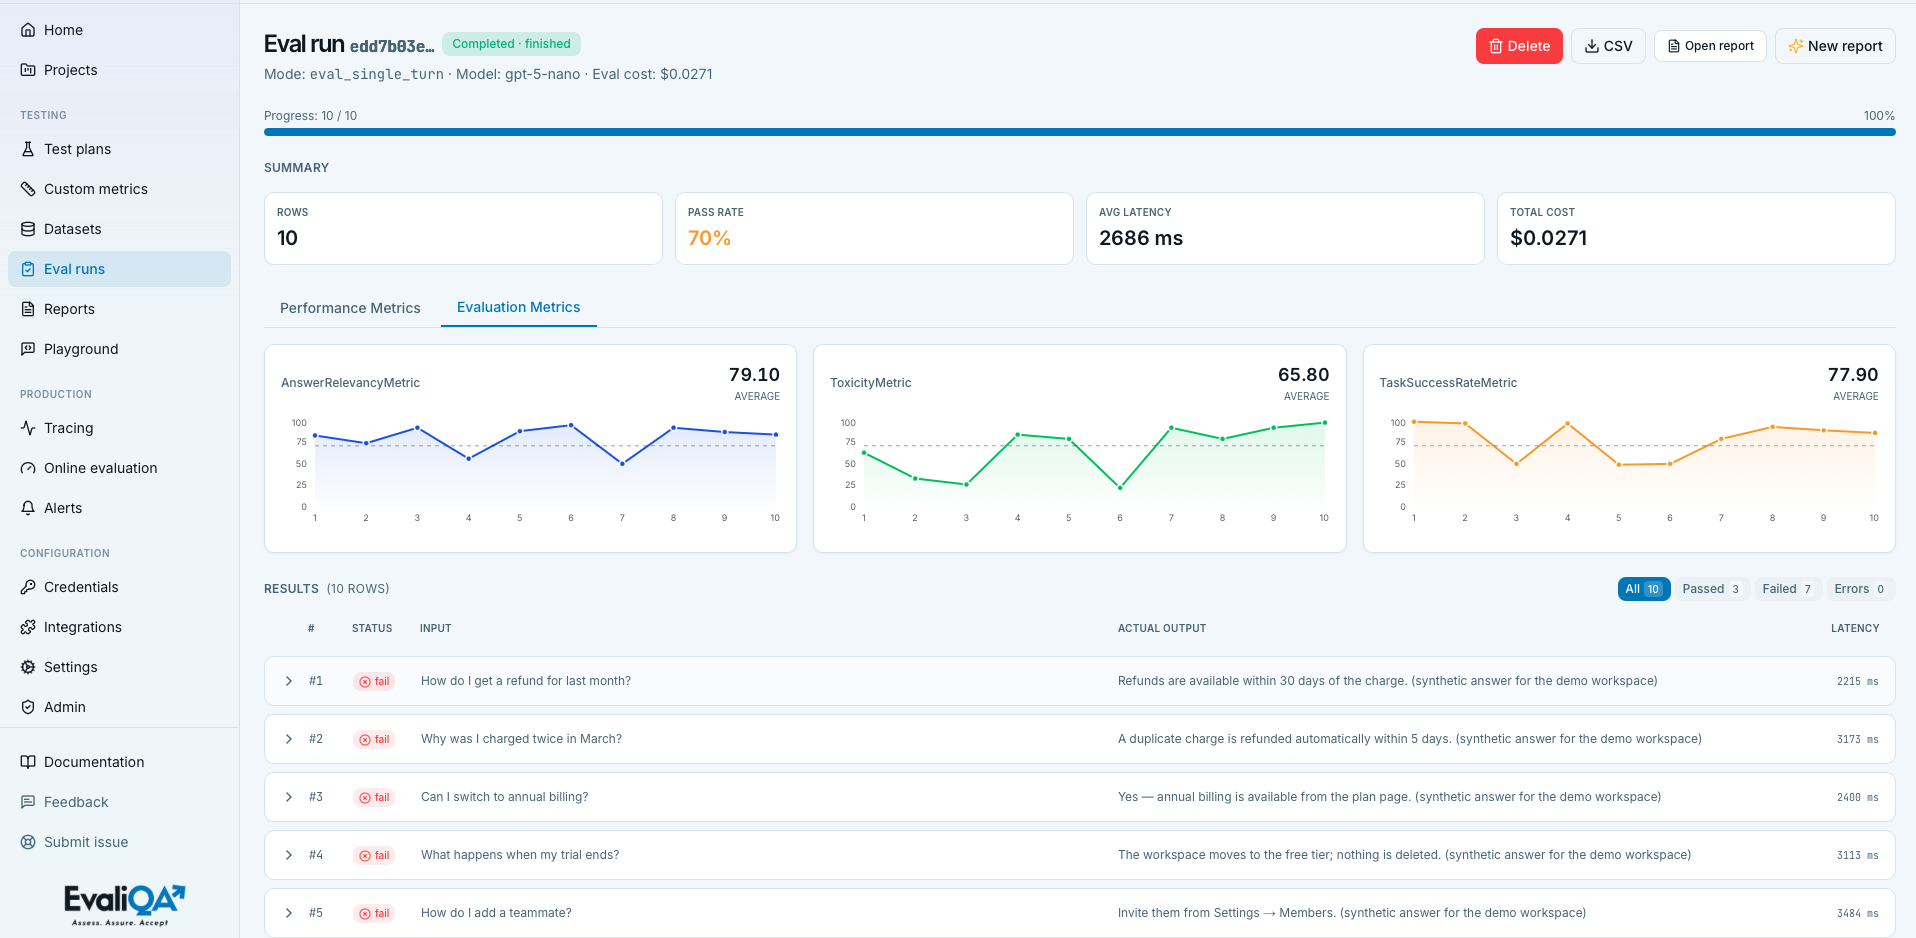
Four KPI tiles across the top:
- Rows: total scored.
- Pass rate: mean pass rate across metrics; green ≥ 80%, amber ≥ 50%, red below.
- Avg latency: computed from the visible page of rows.
- Total cost: the model tokens the run consumed, in USD to four decimals.
Below the tiles, per-metric charts (score distributions with the threshold marker) render as tabs. Red-team runs get an extra summary block: one horizontal bar per vulnerability with breach counts and percentages, plus an errored-count note.
Per-row results
An accordion below the charts. Header line shows # / Status / Input / Actual output / Latency and four filter chips: All / Passed / Failed
/ Errors, each with a count. Filtering is client-side and pagination
is 25 rows per page.
Expand any row to see:
- Left column: Test case #N with launch time, plus either the full chat conversation (multi-turn) or Input / Actual output / Expected answer (single-turn), followed by Context chunks and the system prompt.
- Right column: one Metrics card per metric with the pass/fail
chip,
score / threshold, a coloured bar, the judge's reasoning text, any per-metric error, and per-metric cost. Below that: Response time (ms · HTTP status) and Token usage (model, input / output / total tokens, cost). - Below: Tools called (redteam / agent modes) and any custom outputs your connector returned.
Clicking a metric name inside a row opens a verbose log sheet with the full judge prompt and response.
Generate a report
The header has an Open report link if a report already exists, or a
Generate report button if not (labeled New report once at least
one exists). Clicking it drafts a human-readable summary in the
background and takes you to /reports/{id}, the format your PM
actually wants to read. Disabled while the run is queued or running.
Export
There's a CSV button in the header that downloads
eval-run-{shortId}.csv with every row and its verdicts. No JSONL
export and no "promote to dataset" action on this page yet.
What's next
You just closed the offline evaluation loop. Natural next stops:
- Iterate. Tweak the prompt, model, or retrieval and re-run. Compare runs via the checkboxes on the Eval runs tab of the test plan page, that's where side-by-side pass rates and per-metric deltas live.
- Add more coverage. Grow the dataset with real user turns (promote interesting traces once you have production traffic), see Datasets.
- Wire it into CI. Trigger the same plan on every pull request or nightly build, see Integrations.
- Instrument production. Hook the runtime tracing SDK into your live agent to see real traffic in EvaliQA, see Runtime tracing setup.
Common problems
Run eval is disabled.
Either there's no ready dataset attached, or the plan mode isn't
runnable (voice modes without the voice feature, for example). Attach
or generate a dataset first.
Generate button on Datasets tab is disabled. No LLM credential wired to the plan, or (for non-redteam plans) no metrics bound. Fix on the test plan Edit wizard, Step 3 for credential/model, Step 4 for metrics.
Adaptive multi-turn is greyed out in the wizard. Adaptive strategy needs the Platform AI agent to be configured. Set one under Settings → Platform AI agent (or accept the prompt right after saving your first LLM credential).
Auto-suggest and ✨ buttons don't work. Same, they all go through the Platform AI agent. Configure one and reload.
Run stuck on Queued for a long time. A worker is either backed up or unhealthy. Give it a minute; if it stays queued, check Admin → Workers if you have admin access, or ask a workspace Owner.
I cancelled by mistake. Cancel is instant and there's no undo. Re-open the plan and click Run eval again; the second run picks up from a fresh queue.