Runtime tracing
Two ways to get live traces into EvaliQA, the Python SDK and any OTLP/HTTP exporter, and what you need before either.
Last updated 2026-09-07
Runtime tracing is the live channel. Your production agent reports what it did, one trace per invocation, and EvaliQA stores it, groups it into sessions, attributes it to users, and, if you turn it on, scores it. There is no daemon and no long-lived connection: every trace is one HTTP POST.
The screencast (1:34) follows a trace from arrival to the session it belongs to.
There are two doors in. They land in exactly the same place, so pick by what your app already has, not by what it might need later.
Pick your door
| Python SDK | OpenTelemetry | |
|---|---|---|
| Install | pip install "eval-ai-library[tracing]" | Nothing, if you already emit OTel spans |
| Best for | Python agents, especially LangChain, Claude Agent SDK, CrewAI, LlamaIndex, AutoGen | Bedrock Agents, Azure AI Foundry, an OpenTelemetry Collector, non-Python stacks, n8n, Make, LangGraph Cloud |
| You set | TRACING_ENABLED, TRACING_URL, TRACING_PROJECT, TRACING_API_KEY | OTEL_EXPORTER_OTLP_ENDPOINT, OTEL_EXPORTER_OTLP_HEADERS, OTEL_EXPORTER_OTLP_PROTOCOL, OTEL_RESOURCE_ATTRIBUTES |
| Endpoint | POST /api/traces/ingest | POST /api/traces/otlp/v1/traces |
| Auth header | Authorization: Bearer evx_… | x-api-key: evx_… |
| Sessions and users | session_id / user_id in set_trace_metadata | gen_ai.conversation.id / enduser.id span attributes |
| Guide | SDK setup | OpenTelemetry |
Both doors use the same API key and the same project. You can run both at once, for example a Python orchestrator on the SDK and a Bedrock sub-agent on OTLP, and the traces sit side by side in the same feed.
What you need before either
- A project. Create one under Projects. Every trace belongs to exactly one project, and every API key is bound to one.
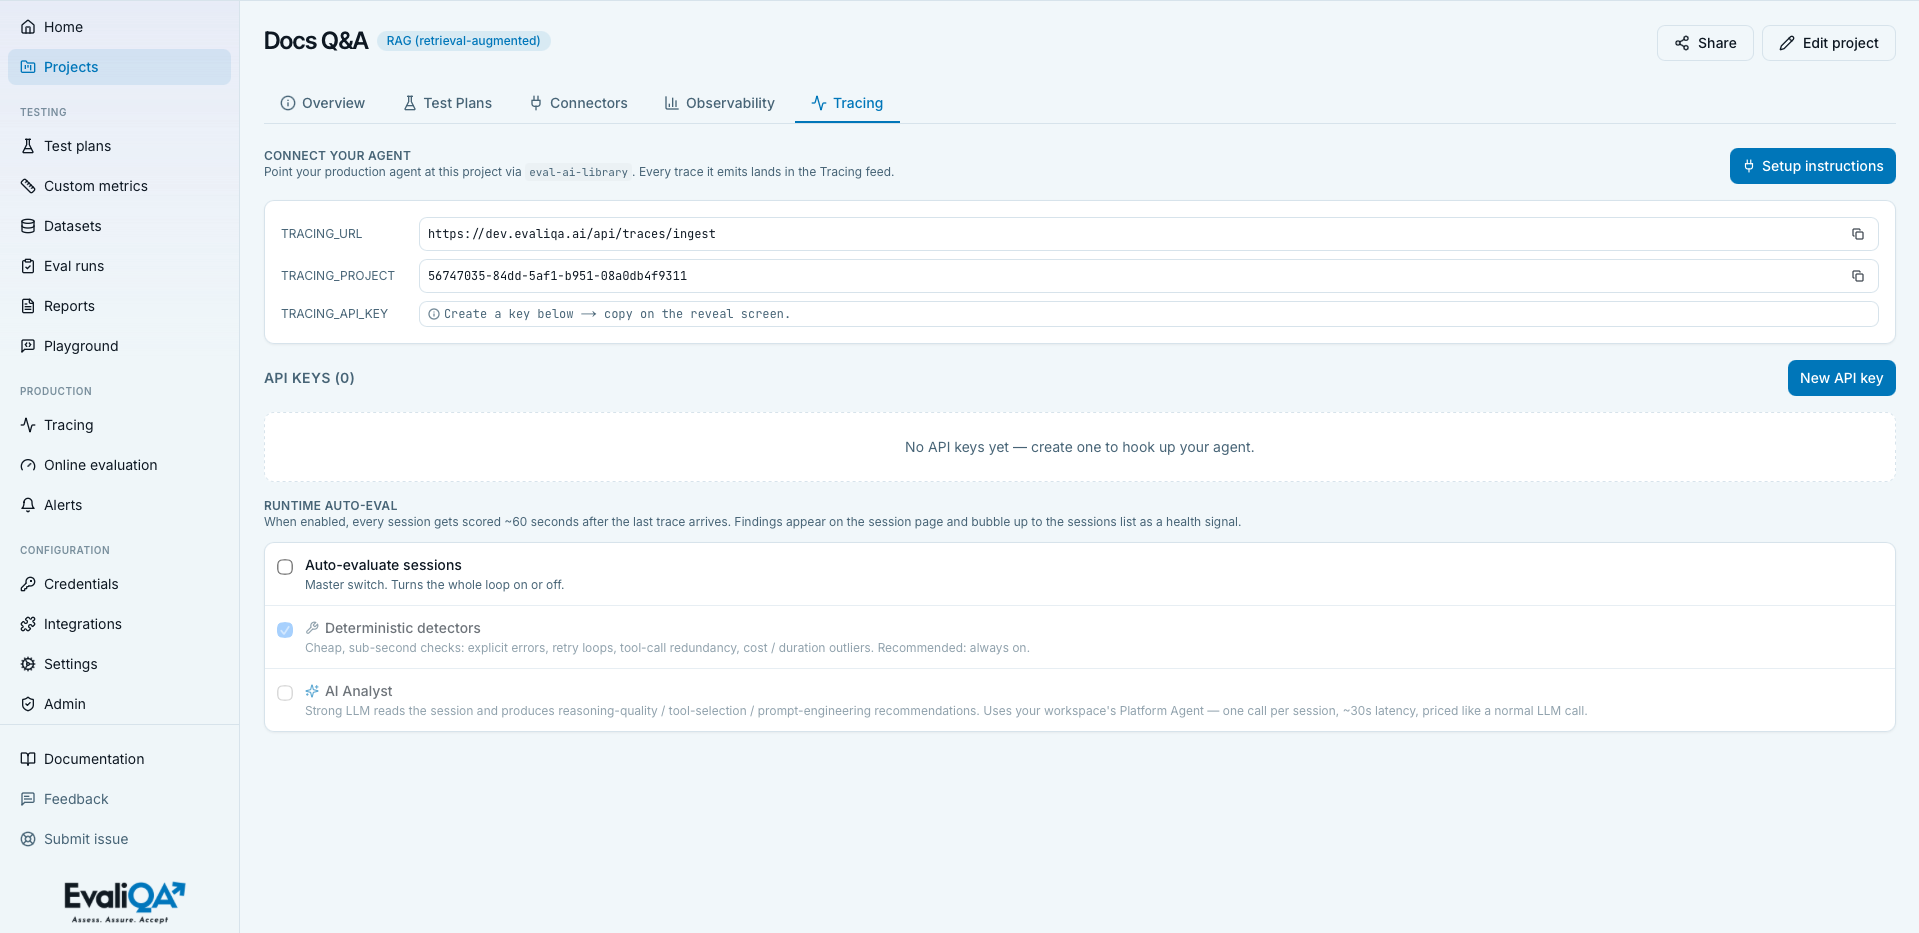
- A tracing API key. Open the project, switch to the Tracing tab,
click New API key, give it a name. The raw
evx_…value is shown once, in a reveal panel with a ready-to-copy env block. Copy it into your secrets store before you leave the page. While the Runtime eval pages are still empty, the setup guide there has a Generate API key button that does the same thing inline. - Your EvaliQA host. The URL you open the UI on. The SDK appends
/api/traces/ingest; an OTel exporter takes/api/traces/otlpand appends its own/v1/traces. Traefik on our side terminates TLS.
Keys can be revoked from the same tab. A revoked key gets 401 on its
next request; the SDK logs the failure and drops the trace, or raises if
TRACING_STRICT=true.
What a trace carries
The vocabulary, smallest to largest:
- Span: one step. An LLM call, a tool call, a retrieval, a reasoning step. Spans nest into a tree.
- Trace: one agent invocation. Holds the span tree plus trace-level
metadata:
model,input,output, tokens,cost_usd, response time, the tools it called. - Session: one user request or one conversation, several traces
sharing a
session_id. A planner and its executors, or the turns of a chat. Online evaluation and alerts work at this level. - User: one end user, many sessions sharing a
user_id.
EvaliQA reads session_id and user_id from the top level of the trace
or from its metadata, whichever you set. Tokens can come as
input_tokens / output_tokens / total_tokens at the top level or
inside a usage object. A trace whose trace_id was already stored is
silently skipped, so a retried POST never duplicates a row.
Endpoints at a glance
| Method and path | Auth | Body |
|---|---|---|
POST /api/traces/ingest | Authorization: Bearer evx_… | {"project": "...", "trace": {...}}, what the SDK sends |
POST /api/traces/ingest_batch | Authorization: Bearer evx_… | {"project": "...", "traces": [{...}, ...]}, for your own sender or a backfill |
POST /api/traces/otlp/v1/traces | x-api-key: evx_… (or Bearer) | OTLP/HTTP, protobuf or JSON, optionally gzip |
All three answer 401 on a bad or revoked key, 402 when the workspace is over its plan's runtime-trace allowance, and 503 when the auth service is unreachable (retry; the SDK and OTel exporters both do).
In this section
- SDK setup, install
eval-ai-library, wire four env vars, send the first trace. - OpenTelemetry, point an OTLP exporter at EvaliQA, no SDK.
- Sessions and users, group sub-agents and attribute traffic to people.
- Framework integrations, callbacks for LangChain, Claude Agent SDK, CrewAI, LlamaIndex, and more.
- Verify and troubleshoot, smoke tests for both doors and the usual failure modes.
Related
- How production monitoring works, the loop these traces feed.
- Explore sessions and traces, where the traces show up.