Online evaluation
Score live sessions against your metrics as they arrive, with deterministic detectors, an AI Analyst, and per-trace metric scoring.
Last updated 2026-09-07
Runtime tracing shows you what your agent did. Online evaluation tells you how well, on real traffic, without anyone pressing Run.
The screencast (0:49) turns scoring on for a project and reads what it produced.
Turn it on for a project and EvaliQA's worker scores every session that arrives: cheap deterministic checks on all of them, the metrics you bound on every trace, conversation-level metrics once the dialogue goes quiet, and, if you want it, a strong model reading the whole session and writing findings. Nothing runs inside your app; the scoring happens on EvaliQA's side, using your workspace's Platform AI agent.
Before you start
- Traces are flowing into the project, with a
session_idon them. Online evaluation works per session; a trace without one is stored but never scored. See Sessions and users. - The Platform AI agent is configured under Settings → Platform AI agent. Every judge call and every AI Analyst call goes through it, on your key, billed by your provider. Without it the metric and analyst engines skip, and say why on the Results row and the session page.
- You have evaluated cases left. Online scoring spends the same evaluated-cases allowance as a test run, one case per trace per metric. The page shows a usage notice as you approach the limit.
1. Turn it on
Open /online-evaluation, pick the project, and switch to the Settings tab. The Runtime auto-eval panel has three switches. Changes save as you make them; the status text next to the heading confirms the write.
- Auto-evaluate sessions: the master switch. Off means nothing below runs, whatever else is ticked.
- Deterministic detectors: sub-second checks that need no model. Explicit errors, retry loops, redundant tool calls, cost and duration outliers. Recommended always on; they cost nothing.
- AI Analyst: a strong LLM reads the session, the detector findings, and the metric verdicts, and writes recommendations on reasoning quality, tool selection, and prompt engineering. One call per session, about 30 seconds, priced like a normal LLM call on your Platform AI agent.
The same three switches sit on the project's Tracing tab next to the API keys, so you can enable auto-eval in the same breath as creating the key. Metric bindings live only here.
2. Bind metrics
Below the switches, Metric scoring lists the metrics this project scores: Metric, Threshold, Applies to, Trace fields. Click Add metric to open the picker. One binding is:
- Metric: anything from the catalogue, built-in or a workspace custom metric. Custom metrics bring their criteria and options from the Custom metrics page.
- Threshold: the pass line, 0 to 1. A score below it is a fail. Pass rate on the Overview tab is computed against this number, and alert rules watch it.
- Trace field mapping: which trace fields feed the metric. The
defaults are the ones you'd guess,
inputfromtrace.inputandactual_outputfromtrace.output. Metrics that need more, an expected answer, retrieval context for RAG metrics, extra context, take a dotted path or a JSONPath into the trace, usually intometadataorspans. - Rule scope: optional filters, so the metric only scores traces
where every condition holds.
contains,starts_with,eq,gt,exists, and friends, over the same field paths as the mapping. The picker shows a sample trace from the project and tells you whether it would match, so you can tune the scope before saving. Empty scope means every trace.
Conversation-level metrics (Role Adherence, Conversational Flow, Knowledge Retention, Goal Achievement, and the rest of the agent family) ask a different question in the picker: What one turn is made of. Point them at the user message and the agent reply per trace, or at a messages list inside one trace if your agent reports a whole dialogue as spans, and EvaliQA assembles the conversation from the session.
3. What runs, and when
Two clocks, and it helps to know which one you're waiting on.
- As each trace arrives: every bound single-turn metric whose scope matches scores that trace immediately. A trace already scored under the current metric configuration is not scored again. Once the verdicts exist, the AI Analyst (if on) reads that single trace and explains them.
- 60 seconds after the last trace of a session: the session-level pass. Deterministic detectors, conversation metrics over the assembled dialogue, the AI Analyst over the whole session, and then the alert rules. Every new trace slides the timer forward, so a long conversation is analysed once, after it ends, not once per turn. If more traces land while the analysis is running, it re-arms and runs again.
Changing the metric configuration affects traces that arrive from then on; history is not re-scored.
4. Read the results
Three places, from wide to narrow.
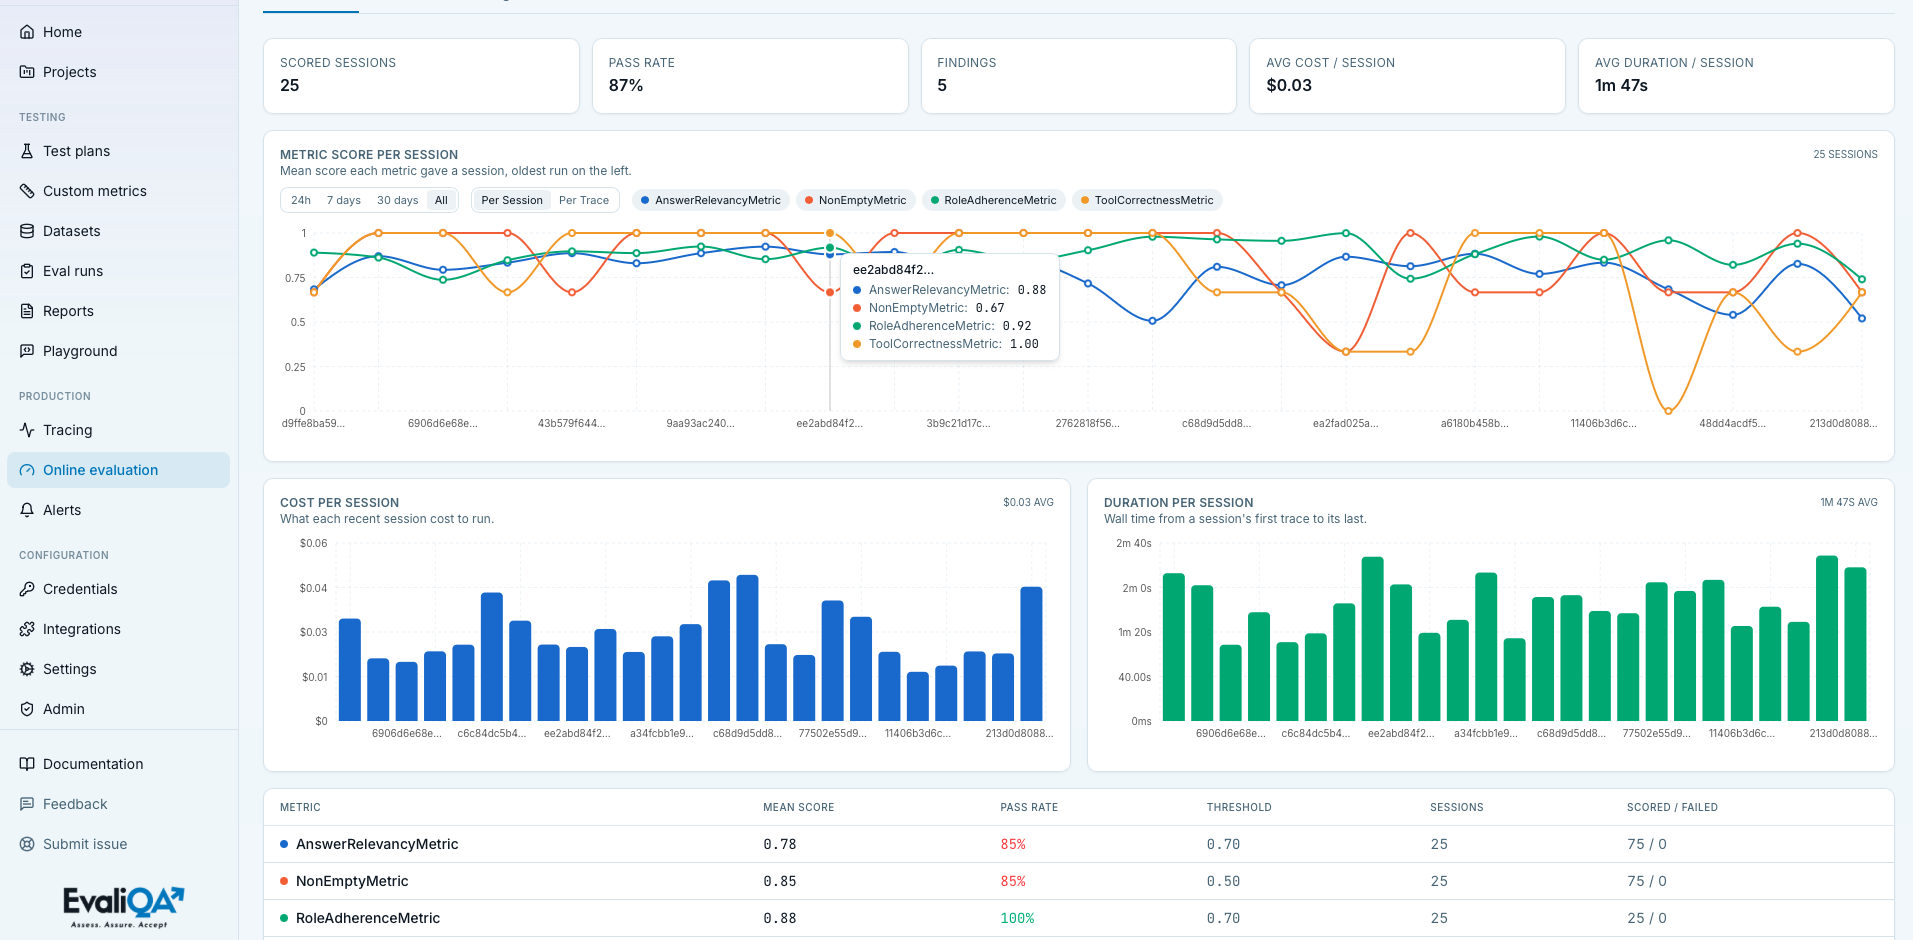
Overview tab. Five tiles, Scored sessions, Pass rate, Findings, Avg cost / session, Avg duration / session, then score over time with a range and metric-scope selector, cost and duration per session, and a per-metric table. This is the "is quality drifting" page.
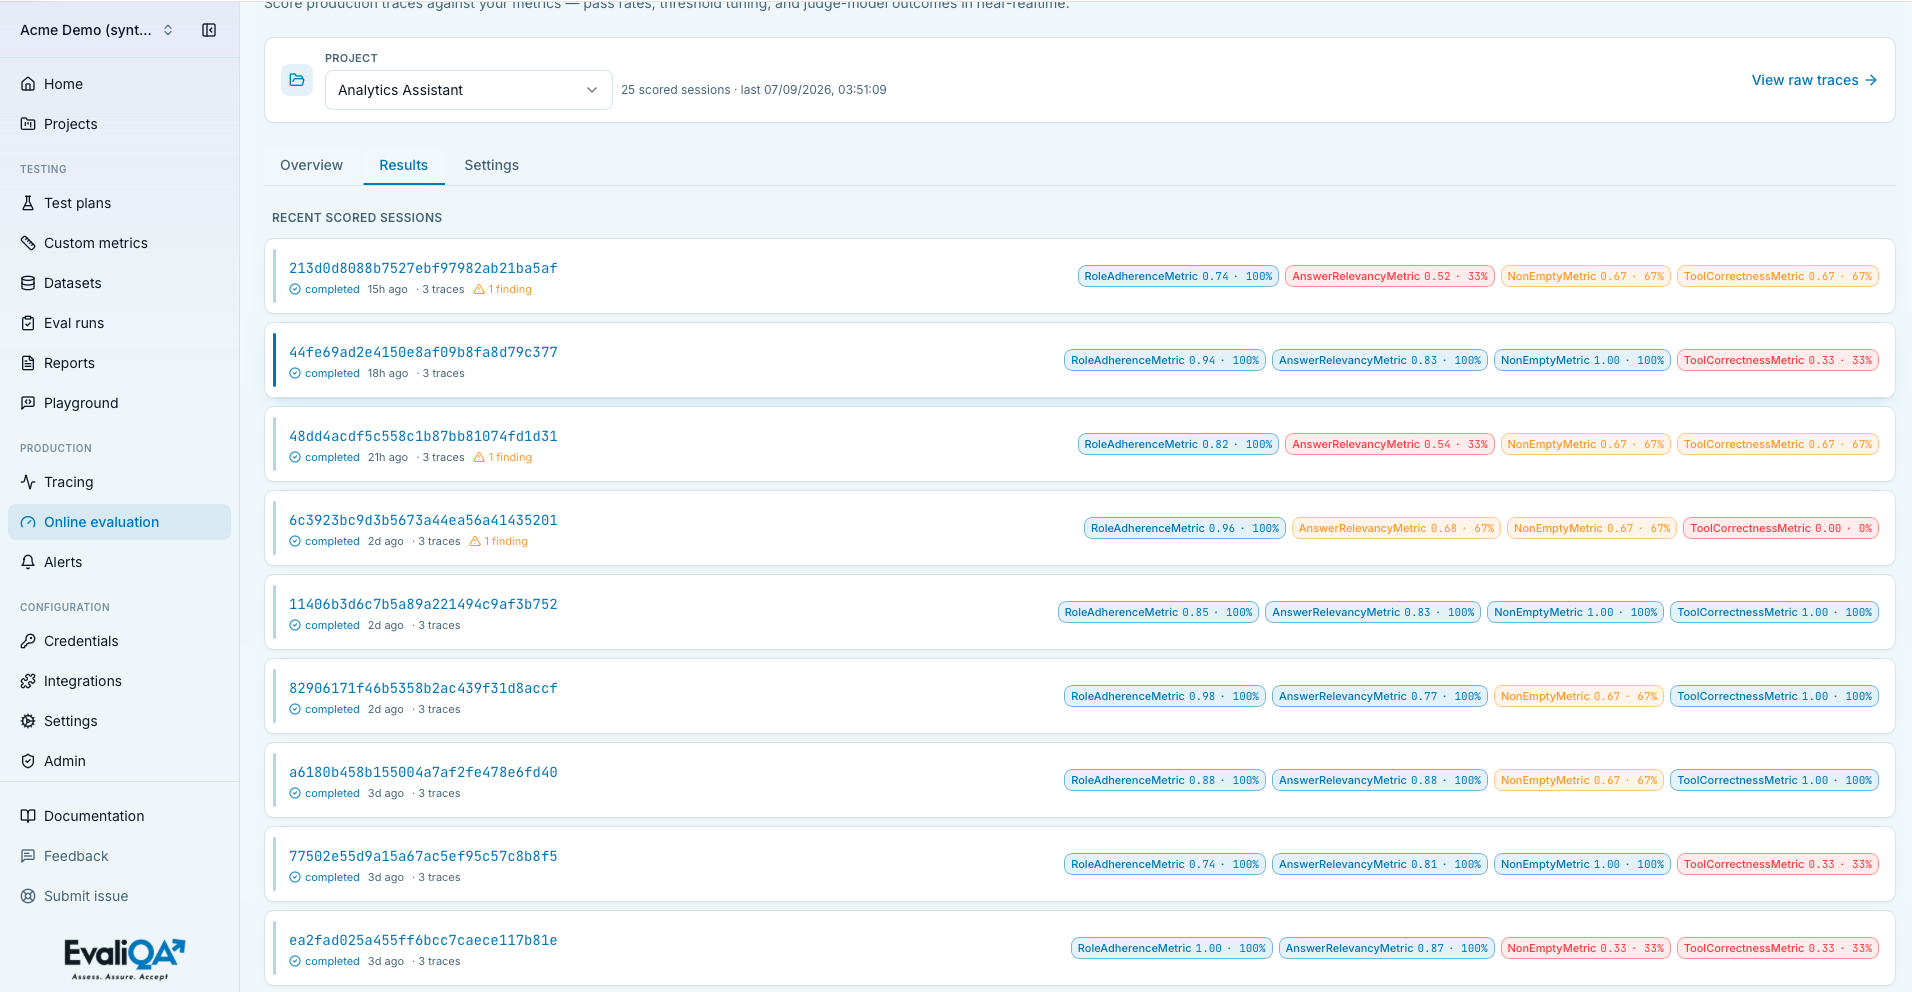
Results tab. Recent scored sessions, the last 25 analyses, newest first. Each row: a status pill (completed, running, pending, failed), when, how many traces, the finding count, and a badge per metric showing the mean score and the pass rate, colour-tiered at 0.9 and 0.5. If one engine didn't run, the reason is printed on the row, for example a missing Platform AI agent.
Session and trace pages. The session page's Analysis panel has the conversation metrics, a summary of the per-trace scores, and the findings. The trace page's Trace metrics card has each metric's score, threshold, and the judge's reasoning. See Explore sessions and traces.
The deterministic detectors
| Finding | What triggers it | Severity |
|---|---|---|
error | A span with status: error or an error field. One finding per error type per session. | warn, critical from 3 occurrences |
retry_loop | Runs of identical adjacent spans, same name and same input. | warn |
redundancy | The same tool invoked with the same arguments more than once across the session. | info |
cost_outlier | The session's total cost reaches 0.50 USD. | warn, critical from 5 USD |
duration_outlier | A trace takes three times the session's median duration (at least 5 s), in a session of three or more traces. | info |
Severities are what alert rules filter on with Finding severity ≥.
Cost control
The detectors are free. Everything else is a model call on your Platform Agent, so bind deliberately:
- Score the metrics you'd act on, not the whole catalogue. Each binding is one judge call per trace it matches.
- Use Rule scope to skip traces that don't need judging: health checks, greetings, a specific tool path.
- Leave the AI Analyst off until you're reading its findings. It's one strong-model call per session, and its value is in the recommendations someone follows up on.
- Prefer conversation metrics for chat products. One call per session beats one call per turn.
Related
- Alerts, rules that watch these scores and findings.
- Metrics, what each metric needs from a trace.
- Runtime tracing, getting the traces in.