

Every metric in EvaliQA turns an AI output into a score between 0 and 1, and a threshold turns that score into a verdict of passed or failed. The verdicts are what you act on. They feed the pass rate on the run page, they decide whether a release gate opens, and they are what a stakeholder reads in the report. The problem is that neither the score nor the threshold means anything about your AI system until you have checked them against your own judgment. A Faithfulness threshold of 0.7 is a catalog default chosen to be a reasonable starting point for most systems. It is not a measurement of where good answers stop and bad answers start for your retrieval pipeline, your prompt and your users. A team attaches five metrics, runs 300 rows, sees a 94% pass rate and ships. Then a customer finds an answer the LLM judge scored 0.72 and called fine.
This post is about metric calibration, the work of making a metric's pass and fail verdicts agree with the verdicts a careful person on your team would give on the same rows. We cover what to label, how to read a score distribution, where to put the threshold, how to check whether the LLM judge is ranking rows the way you would, and how to tell a real change from judge noise. The method applies to built-in judge metrics, custom metrics and deterministic metrics, and it is cheap, usually one or two small runs per metric. What it does not do is rescue a metric that asks the wrong question. If Answer Relevancy is attached to a plan whose real question is factual correctness, no threshold will make it right, and calibration is how you find that out early.
What metric calibration means
Start with the mechanics, because calibration is about the gap between them and reality. For every row of a run, each attached metric produces a score, usually in the range 0 to 1, and once a threshold is set the score becomes a verdict. The rule for most metrics is that a score at or above the threshold passes and anything below fails. A row's overall verdict is the AND of every metric on the test plan, so one failing metric fails the row. The catalog assigns each metric a default threshold between 0.5 and 0.8, and you can override it per plan on the Params step of the test plan wizard, right after the Metrics step where you attach them. The metrics hub describes the full mechanism.
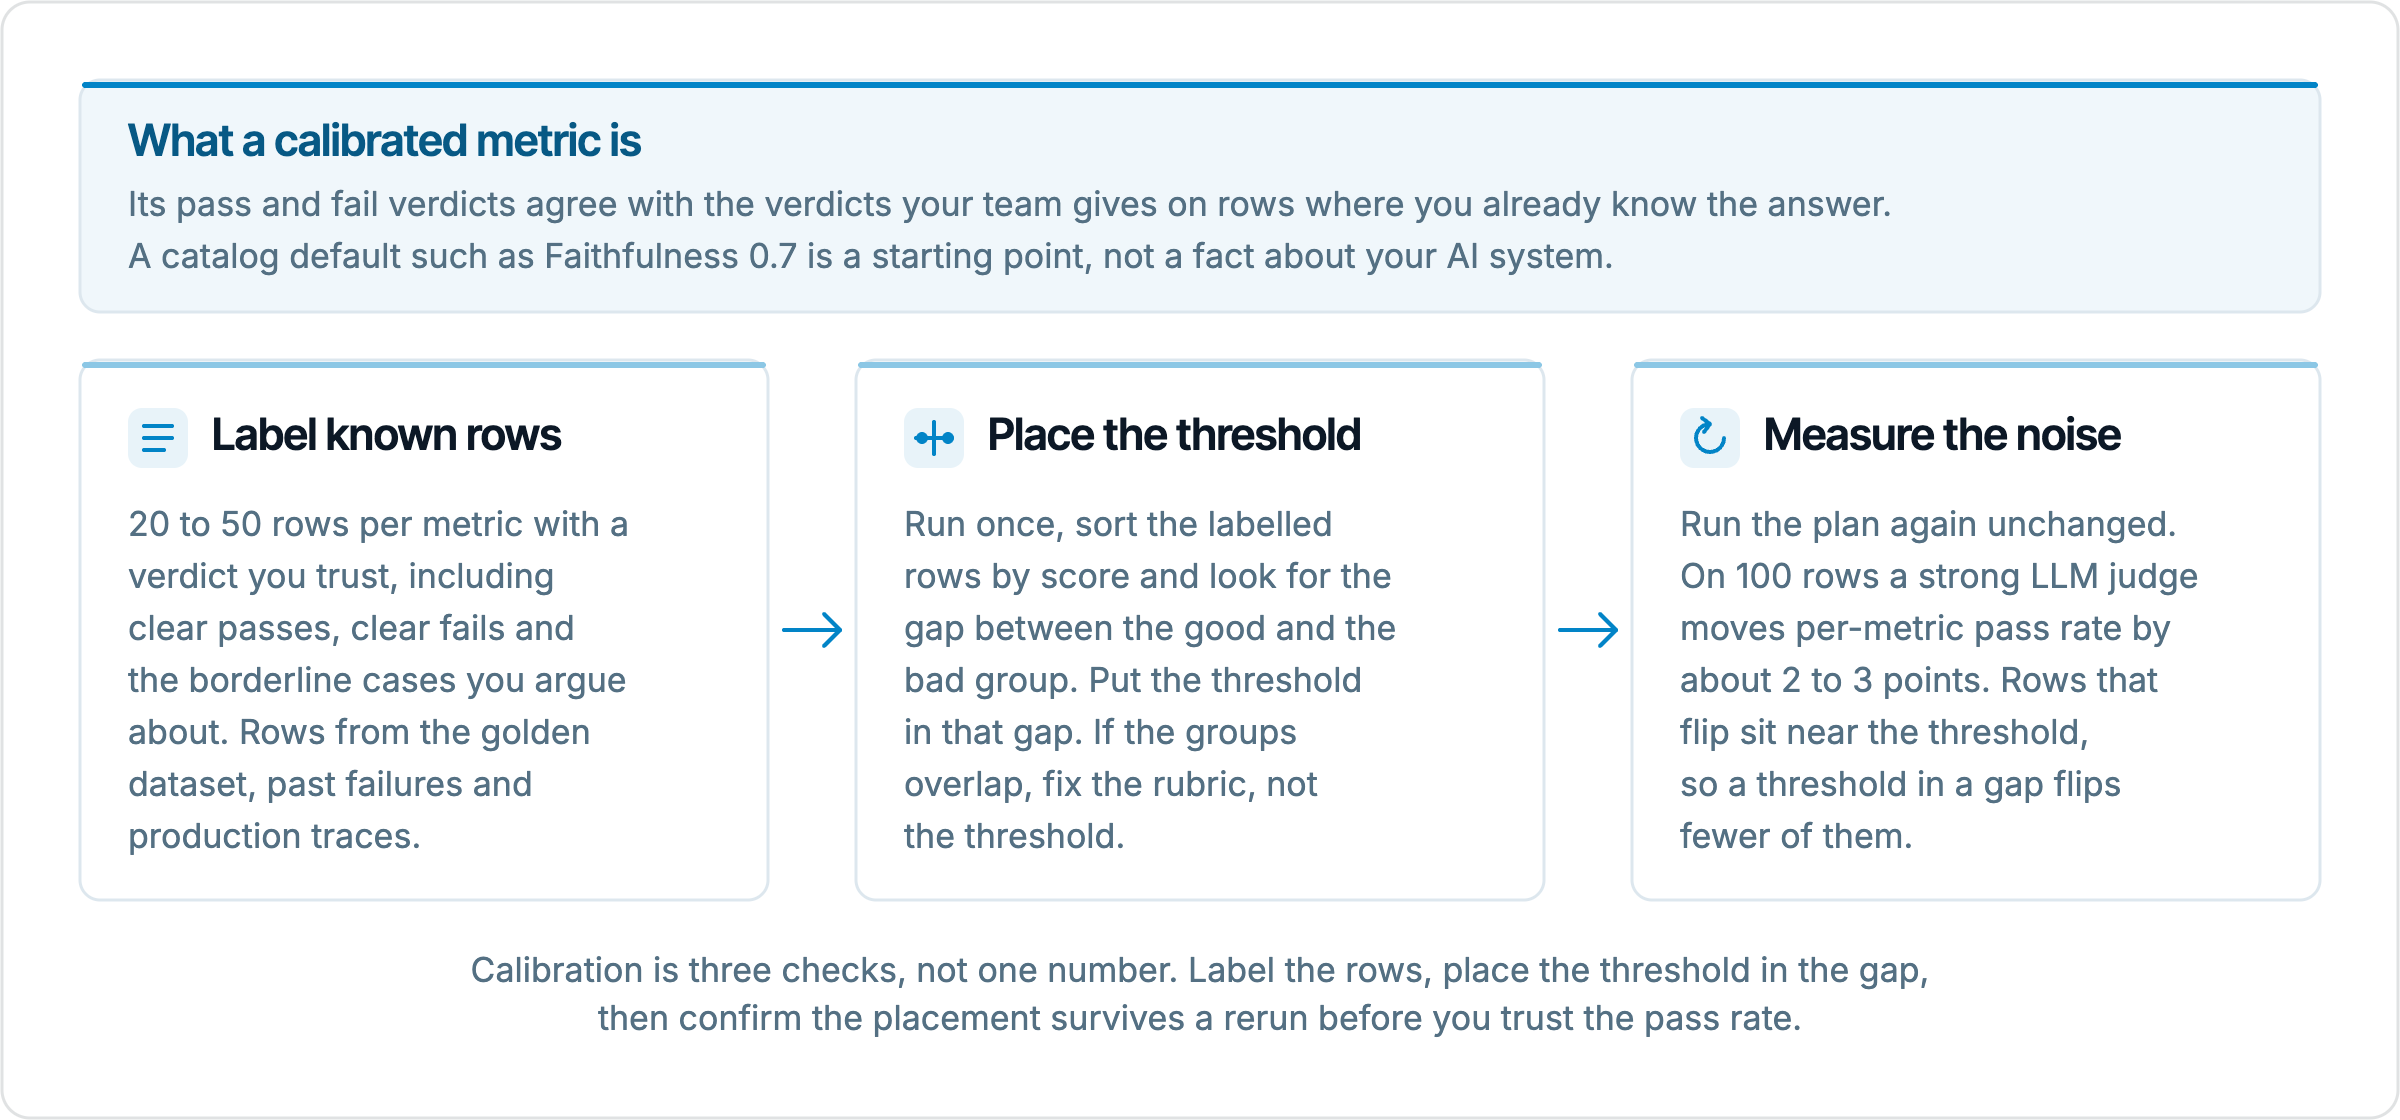
A metric is calibrated when, on rows where you already know the right verdict, the metric gives that verdict. There are two distinct ways a metric can fail this test, and they need different fixes. The first is threshold miscalibration. The metric ranks the rows correctly, good answers score higher than bad ones, but the cut is in the wrong place, so a cluster of acceptable answers at 0.65 fails under a 0.7 threshold, or a cluster of bad ones at 0.72 passes. Moving the threshold fixes this completely. The second is rubric miscalibration. The LLM judge is ranking rows differently from you, so some bad answers score above some good ones, and no threshold can separate the groups. Only changing what the judge is asked fixes this, and that may mean editing a custom metric's criteria, changing a built-in metric's parameters, or picking a different metric.
Defaults cannot be right for everyone because the score scale depends on things the catalog cannot know. The judge model matters, since a stronger judge produces a different spread of scores than a weaker one. The shape of the answers matters, since a terse support bot that answers in one sentence and a verbose assistant that answers in four paragraphs will get different Answer Relevancy distributions for the same underlying quality. The domain matters, since what counts as a faithful claim in a legal assistant is stricter than in a product recommender. The default of 0.6 for Answer Relevancy or 0.7 for Faithfulness is where the catalog authors put the bar for a typical system, and your system is not typical in some way you have not measured yet.
The signs of an uncalibrated metric are easy to spot once you know them. A metric that passes 100% of rows on your golden set is almost certainly set too low and is not discriminating anything. A metric that fails every row usually points at the wrong column, the wrong direction, or a question the plan was never designed to answer. The quieter sign is a row list where many passes sit just above the bar, at threshold plus 0.01, which means the threshold is in the dense part of the distribution and small judge noise will flip those rows next run. The table below summarises what calibration involves for each kind of metric, and the sections that follow go through each step.
Metric kind | What you calibrate | How you check it | What calibration cannot fix |
|---|---|---|---|
Built-in LLM judge metric (Faithfulness, Task Success Rate) | Threshold, and any parameters such as success criteria or chatbot role | Labelled rows, score distribution, judge reason on disagreements | A rubric that asks a different question from yours |
Custom metric (G-Eval, Custom Eval) | Threshold, criteria text, level anchors, Custom Eval temperature, sample or run counts | 5 known-outcome rows, then 20 to 50 rows with reasons read | A vague criterion the judge scores on plausibility |
Embedding metric (Semantic Similarity, Reference Match) | Threshold only | Score the right and wrong groups, set the bar between them | Negation and one-fact differences that embeddings rate as similar |
Rule check (Regex Match, Contains, Length Check) | The rule itself, since scores are 0 or 1 | Run on labelled rows and read the false passes and false fails | Anything the rule cannot express |
Build a calibration set
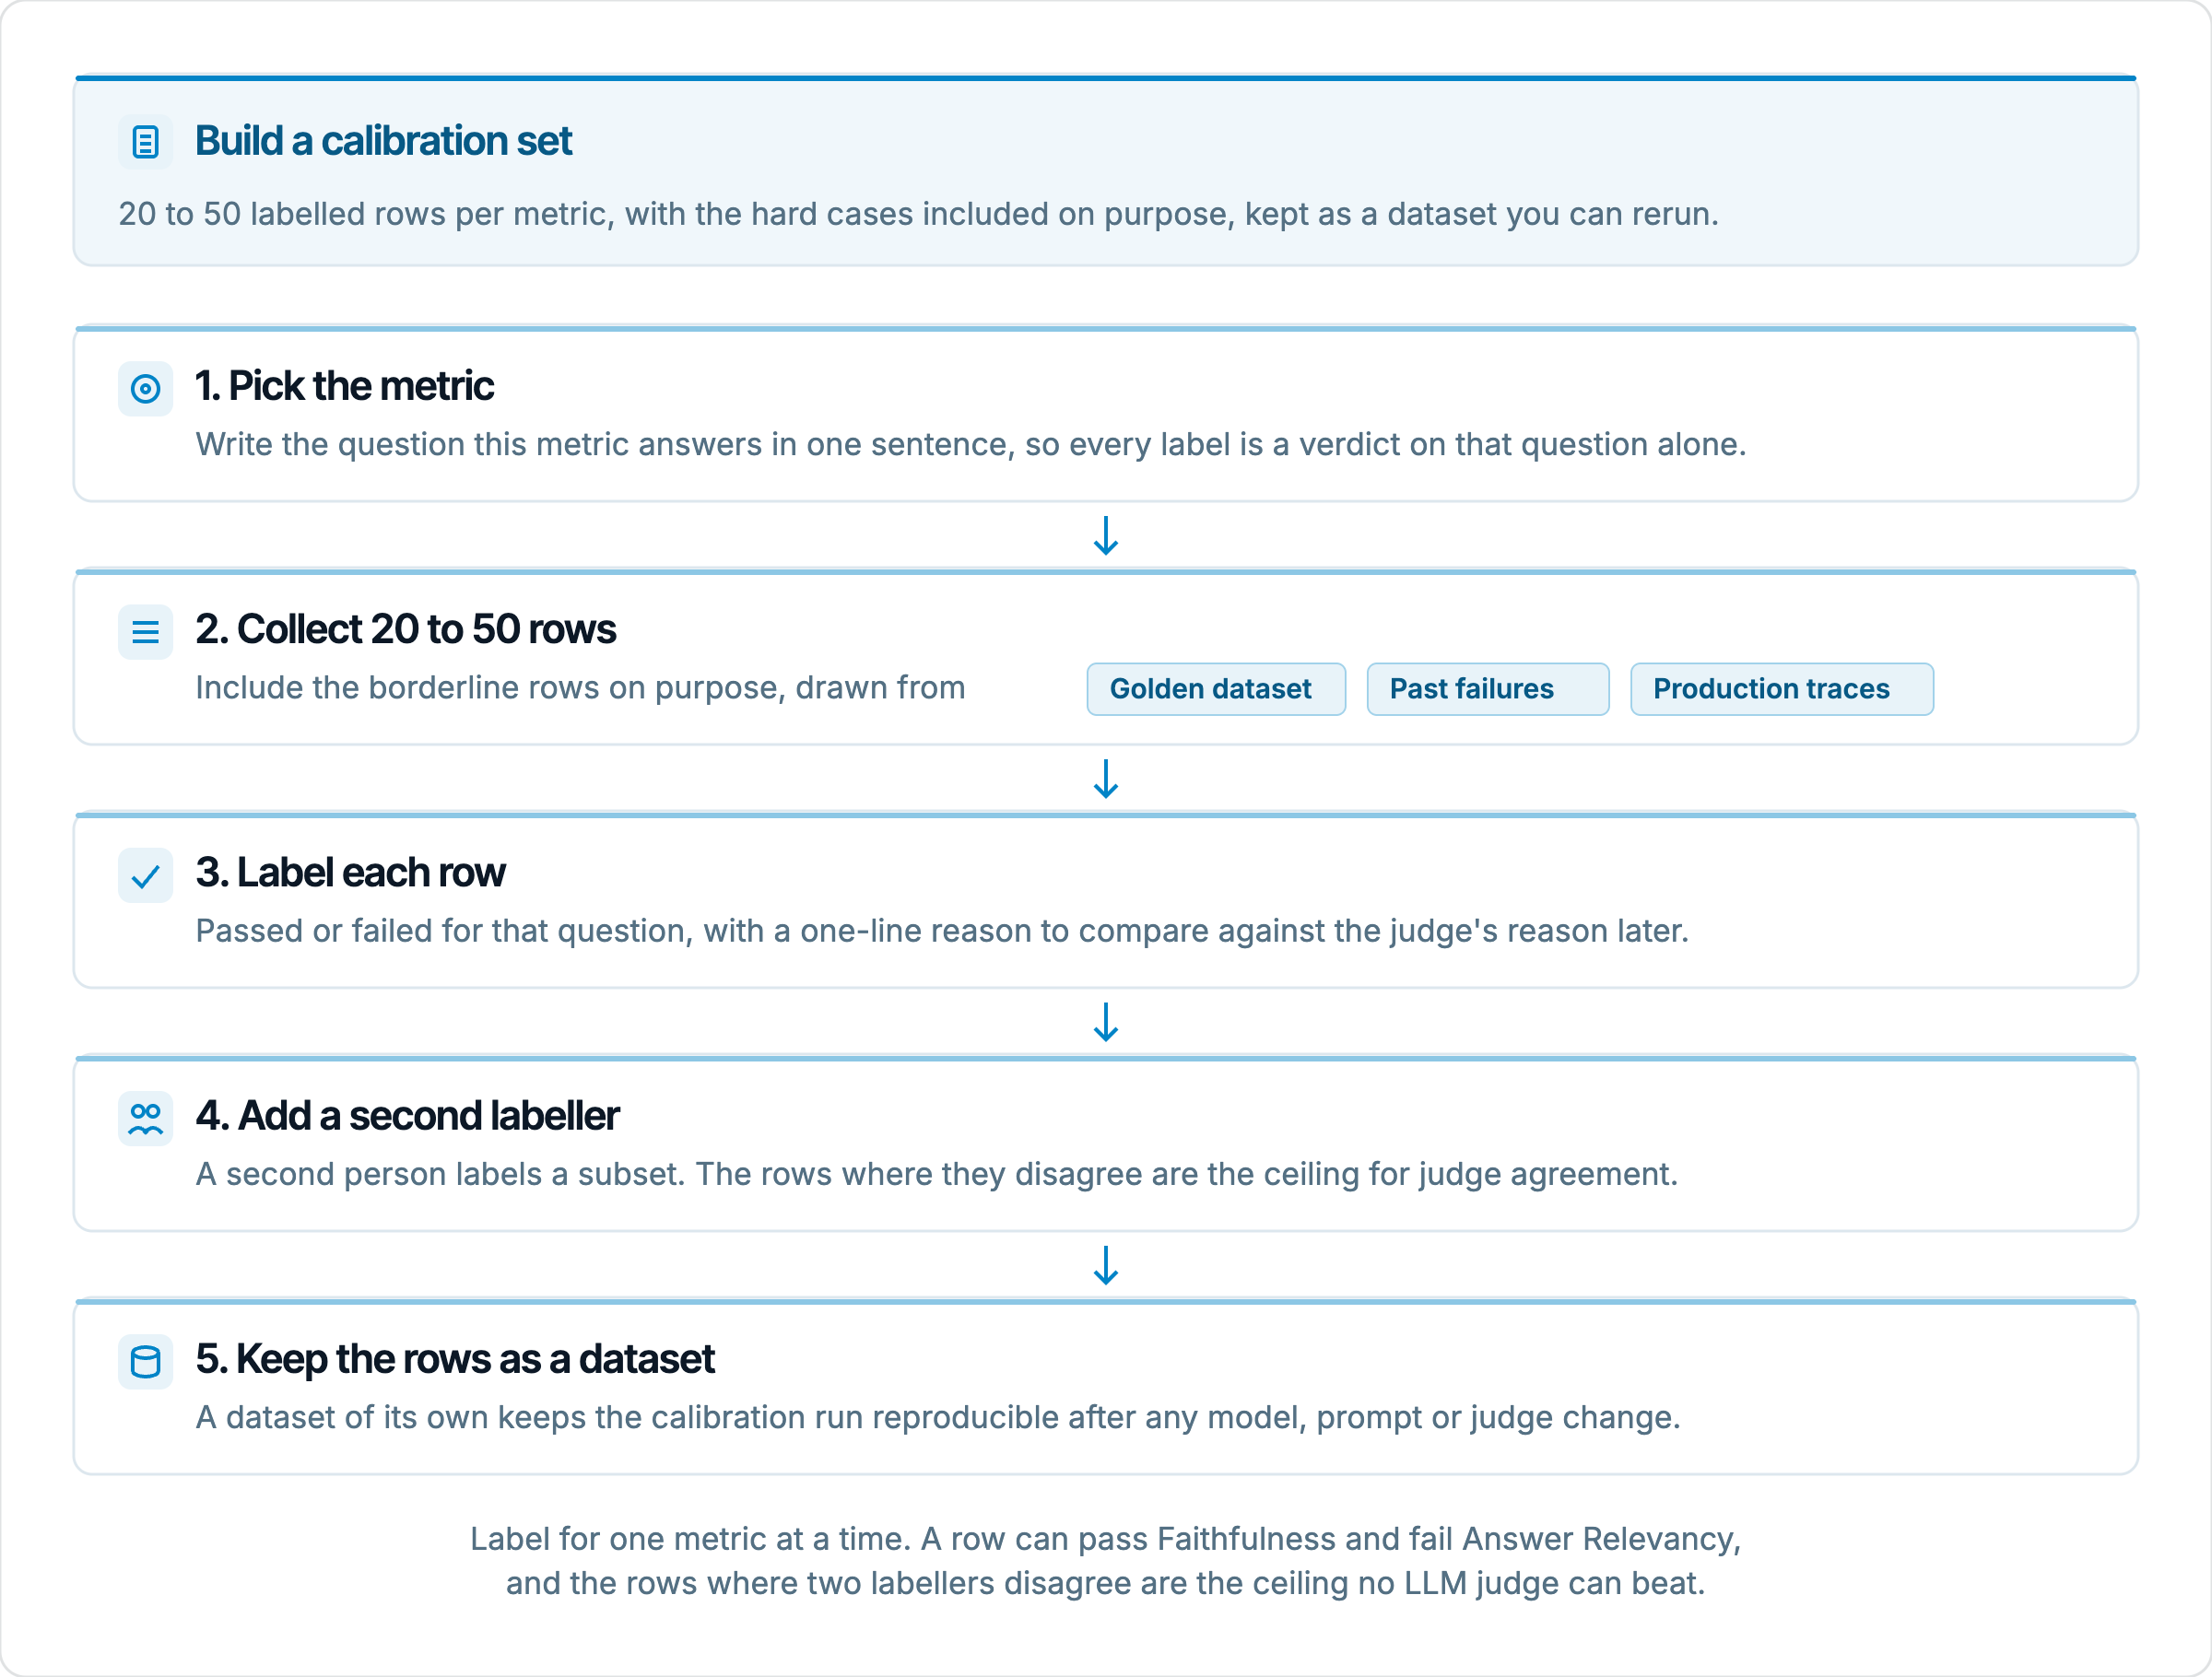
Calibration needs rows with known verdicts, so the first job is to label some. The custom metrics guide recommends testing a new rubric on 5 hand-picked rows before attaching it to a large plan, with 2 clear passes, 2 clear fails and 1 ambiguous row. That is the right minimum for catching a rubric that is badly off, and it takes about 5 minutes. It is not enough to place a threshold, because a gap between two good rows and two bad rows is not a gap, it is luck. For threshold work we label 20 to 50 rows per metric, which matches the size the same guide suggests for the first real iteration run. The rows should come from three places. Your golden dataset supplies the answers you are sure about. Failing rows from previous runs supply the failures you have already argued over. Production traces promoted into test cases supply the inputs real users actually send, which are often messier than anything written by hand.
The labelling itself is where most of the value is created, so do it carefully. Each row gets a verdict, passed or failed for the specific question this metric asks, plus a one-line reason. The reason matters because later you will compare it with the judge's reason on the same row, and a disagreement in reasoning tells you more than a disagreement in score. Label for one metric at a time. A row can be a pass for Faithfulness and a fail for Answer Relevancy, and a single "good or bad" label blurs exactly the distinction you are trying to calibrate. If two people can label independently, do it, and count the rows where they disagree. Those rows are the ceiling. A metric cannot agree with your team more consistently than your team agrees with itself, and knowing that ceiling stops you from spending a week chasing an agreement rate that no judge could reach.
Include the borderline rows on purpose, not just the clear ones. For Faithfulness in a support RAG system, the interesting row is the answer that is factually correct but not supported by the retrieved context, because the model knew the fact from pretraining. A careful labeller fails it, since the metric asks about grounding, not truth, and that row tells you whether the judge agrees. For Task Success Rate on an AI agent, the interesting row is the conversation where the agent did everything right except the final confirmation. For a brand tone custom metric, it is the answer that is polite but uses a competitor's name. If your calibration set has only obvious rows, the threshold you get will look great and will fail on the first ambiguous production case.
The steps, in order, are short enough to write down once and reuse for every new metric.
Set the threshold from the distribution
Run the test plan once on the calibration dataset with the metric attached at its default threshold. On the run page, the per-metric charts under the KPI tiles show each metric's score distribution with a marker at the current threshold. Expanding a row shows a card per metric with the score next to the threshold, written as 0.850 / 0.70, a marker on the bar, and the judge's full reason underneath. For calibration you want the scores next to your labels, so export the CSV and put your verdict column beside the metric's score column, then sort by score. What you are looking for is the gap, the band of scores between the lowest known-good row and the highest known-bad row. The deterministic metrics guide gives this advice for Semantic Similarity, and it is the right advice for every metric that produces a continuous score. Put the threshold inside the gap.
Suppose you labelled 30 rows for Faithfulness on a support bot, 18 good and 12 bad. Sorted by score, the 18 good rows run from 0.78 up to 1.0 and the 12 bad ones from 0.2 up to 0.66. The gap is between 0.66 and 0.78, so the default of 0.7 happens to work, and 0.75 would leave a little more room on the strict side. Now suppose the picture is different and the good rows run from 0.62 upward while the bad ones top out at 0.71. There is no gap, three bad rows score above four good rows, and any threshold you pick trades false passes against false fails. That is rubric miscalibration, and the next section is the fix. The point of the exercise is that you cannot tell which situation you are in from the pass rate. A 90% pass rate is consistent with both.
Where in the gap you put the threshold depends on which mistake costs more. A false pass on PII Leakage or Harmful Content is an incident, so the threshold should sit at the strict end of the gap, and the bottleneck guide says to treat every failure on those metrics as an incident rather than noise. A false fail on a tone metric costs you a few minutes reading a row that was actually fine, so a threshold in the middle of the gap is sensible. When a metric is already at 100% pass across the golden set, the metrics hub's advice applies directly, tighten it, for example from 0.7 to 0.85, and run again until it starts to discriminate. The tightening is not cheating. A metric that cannot fail anything is not measuring anything.
One more constraint on the threshold is where the dense part of the distribution sits. If most of your scores cluster between 0.68 and 0.74 and you put the threshold at 0.7, a large fraction of rows sit within judge noise of the bar, and they will change verdict between identical runs. A threshold placed in a gap flips few rows, because few rows are near it. This is the reason the noise floor section below comes before you declare the threshold final. It is also why the bottleneck guide tells you to sort by score ascending and read the rows that passed by 0.01. Those rows are not passes in any meaningful sense, they are coin flips that happened to land heads.
Calibrate the LLM judge rubric
When the good and bad groups overlap, the judge is ranking rows differently from you, and the first move is to read its reason on every row where you disagree. Each metric card in the expanded row shows the reason in full. The bottleneck guide puts it plainly, half the time the bug is the metric asking the wrong question. A Faithfulness judge that passes the pretrained-knowledge answer will say something like "the claim is accurate", which tells you it is scoring truth instead of grounding, and that is a prompt the judge was given, not a threshold. A Task Success Rate judge that passes the conversation without the final confirmation will explain that the booking details were all collected, which tells you its idea of success stops one step before yours. The reasons cluster. Read 5 to 10 disagreeing rows and the pattern is usually one sentence long.
For a built-in metric you cannot edit the rubric, but several carry parameters that shape it. Task Success Rate takes a task description and success criteria. Goal Achievement requires a user goal. Role Adherence requires the chatbot role. Tools Error takes a list of error types to look for. If the judge's idea of success is one step short of yours, writing the final confirmation into the success criteria often closes the gap without touching the threshold. If no parameter captures the distinction, the honest fix is to accept that the built-in metric answers a neighbouring question and to add a custom metric that answers yours. The metrics hub warns against stacking four metrics that ask the same thing three ways, and calibration is where you discover whether two metrics are actually the same question.
For a custom metric the rubric is yours, and the guide on writing criteria lists what moves agreement. Vague criteria such as "the response is helpful" are scored on plausibility and pass almost anything, so state the pass condition concretely. Anchor with a pass example and a fail example, which the guide notes cuts judge variance more than raising the sample count does. For Custom Eval with the verdict strategy, define what none, minor, partial, mostly and fully mean for each criterion, otherwise the judge improvises its own levels and your threshold is calibrated against a scale that drifts. Split compound criteria so the reason names which part failed. And when the criterion is about correctness, point the judge at the row's reference answer through the expected output placeholder, since the judge cannot verify a fact on its own.
Custom Eval has one more calibration knob that is easy to miss. With the verdict strategy, the temperature parameter controls how strictly the per-criterion verdicts combine. At the default of 0.8 the score is a lenient average, so one weak criterion does not fail an otherwise good answer, which suits a quality rubric. At 0.3 a single criterion judged none pulls the score to 0, and the Every criterion must pass switch sets that value for you. This is calibration of the aggregation rather than the bar, and it matters more than the threshold when your criteria are rules. A compliance rubric at temperature 0.8 can pass an answer that violates one rule outright because the other four were fine, and no threshold between 0 and 1 will reliably catch that. Decide first whether the criteria are rules or qualities, then set the threshold.
The judge model is part of the instrument, and the rubric is calibrated against a specific one. On platform credits the judge is picked and pinned for you. On your own key you choose it on the LLM Judge step of the wizard, and it applies to every judge metric on the plan. Changing the judge changes the score scale, so a threshold calibrated under one judge does not carry over to another, and the comparing runs guide is firm that you should never swap the judge and tune a rubric in the same experiment. During rubric iteration, keep the cost down. G-Eval defaults to 20 samples per row, which is 20 judge calls per row per metric, and the guide suggests 5 to 10 samples while iterating and the full count for release runs.
Measure the noise floor first
Before you trust a calibrated threshold, you need to know how much the numbers move when nothing changes. LLM judges sample at non-zero temperature, so two runs of the same plan on the same dataset with the same target and the same judge do not produce identical scores. The comparing runs guide gives the typical noise floor on a 100-row plan with a strong judge. Per-metric pass rate moves by about 2 to 3 percentage points between identical runs, aggregate pass rate by 1 to 2, and 95 to 98% of rows keep the same verdict. Run your calibration plan a second time unchanged and compare. If your numbers move within that band, the calibration you read from the first run is usable. If they move more, you cannot read a threshold from a single run, and the noise has to come down before calibration means anything.
The rows that flip between identical runs are the useful output of the second run, not the aggregate. Open the two runs from the test plan page, tick both on the Eval runs tab and use Compare, then look at which rows changed verdict. Almost all of them will have scores near the threshold, which is the empirical version of the argument in the threshold section. A threshold in a gap flips few rows because few rows live there. A threshold in a dense region flips many. If a large share of your calibration rows flip, move the threshold toward the sparser side of the distribution, even at the cost of a slightly higher false fail rate, because a verdict that changes with the weather is worse than a verdict that is slightly strict.
When the noise is too large to work with, the guides list three levers. Use a stronger judge, since a small or low-reasoning judge produces noisier scores and misses subtle failures. Lower the judge temperature on metrics that expose it. On Custom Eval with the direct strategy, turn on consensus aggregation and set the number of runs to 3 for a light consensus or 5 for a stricter one, which multiplies judge calls by that number but takes the median of several opinions instead of one. For G-Eval, the sample count plays the same role. Each of these costs money per row, which is why you measure the noise first and only pay for the reduction where a metric is both important and noisy.
The noise floor also sets the effect size you need before claiming that a change to the AI system helped. The comparing runs guide treats a 2 percentage point delta as probably noise and asks for 5 or more points on the primary metric, or a consistent 2 or more across several metrics, before calling it a signal. A freshly calibrated metric does not change that arithmetic, but it does make the delta more meaningful, because a change of 5 points on a metric whose verdicts match yours is 5 points of something you care about. The same 5 points on an uncalibrated metric might be 5 points of the judge agreeing with itself.
Deterministic metrics need calibration too
It is tempting to skip calibration for metrics that do not use a judge, since they are reproducible and free. Reproducible is not the same as right. The rule checks in the deterministic group, Exact Match, Contains, Regex Match, Starts With, Ends With, Length Check, JSON Schema, Format Check and Language Detection, score 0 or 1, so the threshold has no effect and what you calibrate is the rule. A Regex Match pattern written for one date format silently fails every answer that uses another. A Contains check in all mode with four keywords fails the answer that used a synonym for one of them. A Length Check set to 50 to 500 characters fails the one-word answer that was exactly right. Run these on the same labelled rows and read the false passes and false fails. The fix is to the pattern, the keyword list or the bounds, and the labelled set shows you exactly which rows the rule got wrong.
Semantic Similarity and Reference Match compare meaning with a local embedding model, and they produce a continuous cosine similarity with a default threshold of 0.7, so the gap method applies directly. Calibration on these two is also where you learn their ceiling. The deterministic guide gives the example that with the default model, "Refunds are available within 30 days." and "Refunds are not available within 30 days." score 0.93 against each other. If your calibration set contains a wrong answer that differs from the right one by a negation or a single number, you will see it score above most of your correct answers, and no threshold will separate the groups. That is not a reason to lower the threshold. It is a reason to use a judge metric that names the fact, or Answer Precision when the answer is that fact alone, and to keep Semantic Similarity for what it does well, which is cheap regression checks on large datasets where a correct answer can be phrased many ways.
Answer Precision is the one RAG metric that runs without a judge. It scores text overlap with the expected output with a tolerance for numbers, and defaults to 0.8. On short factual answers, a number, a name, a code, the groups usually separate cleanly and the default is close. On free-text answers it is the wrong metric, because a correct paraphrase has low overlap, and calibration will show that as a pile of known-good rows scoring low. When that happens the answer is not a lower threshold but a different metric, which is the same lesson as the embedding case. Calibration tells you where a metric stops working as much as it tells you where the bar goes.
Keep metrics calibrated over time
A calibration is a measurement taken under specific conditions, and the conditions change. The metrics hub says to re-check thresholds whenever you rotate the target model or make a large prompt change, because metric behaviour shifts under a new model, and the same applies to a change of judge on your own key. The practical version is to keep the calibration dataset as a dataset of its own and rerun it after any such change, which takes minutes. Compare the new score distribution to the one you calibrated against. If the gap moved, move the threshold with it, and say so in the report, because a pass rate that changed partly because the yardstick moved is not a product result. The comparing runs guide is explicit that runs where a metric or threshold changed are plan-tuning runs, not product runs, and that only the per-metric numbers for unchanged metrics stay comparable across them.
Custom metric presets have a property that affects this. Attaching a preset to a plan copies its settings into the plan, so later edits to the preset do not reach plans that already use it. That is good for reproducibility, old runs keep scoring the way they scored, but it means a recalibrated rubric or threshold does not propagate on its own. After editing the preset, open each plan that uses it, remove the preset on the Metrics step and add it again, then rerun against the calibration dataset to confirm the change moved verdicts the way you expected. We also put the calibration result in the preset's description field, the size of the labelled set, the agreement rate and the date, so the next person who opens it knows what the threshold was calibrated against and when.
Two cadences from the guides are worth adopting as they stand. On every finished run, read the judge's reason on 3 to 5 failing rows per metric and check that the reason matches what you meant the metric to measure. Quarterly, prune metrics that pass 100% of rows, since they cost judge calls and give no signal, and revisit custom rubrics, since a rubric written for version 1 of the product is often misaligned with version 3. Between those, the cheapest early warning is the borderline list. Sort the rows of any run by score ascending and read the passes that cleared the bar by a hundredth. When that list grows from one run to the next, the distribution is drifting toward the threshold, and it is time to rerun the calibration set before the drift turns into a regression you cannot explain.
Summary
A threshold is a claim that scores above it are good and scores below it are bad, and the only way to know whether the claim holds for your AI system is to test it on rows where you already know the answer. Label 20 to 50 rows per metric with the hard cases included, run once, and look for the gap between the good and bad groups. If there is a gap, the threshold goes inside it, toward the strict side when a false pass costs more. If there is no gap, the LLM judge is answering a different question from yours, and the fix is the rubric, the metric's parameters or a different metric, never the threshold. Run the plan a second time unchanged so you know the noise floor and which rows sit close enough to the bar to flip. Then treat the result as a measurement with a date on it, and take it again whenever the target model, the prompt or the judge changes. Done this way, a 5 point move on a metric is 5 points of something your team would recognise as better, which is the only kind of number worth putting in a report.